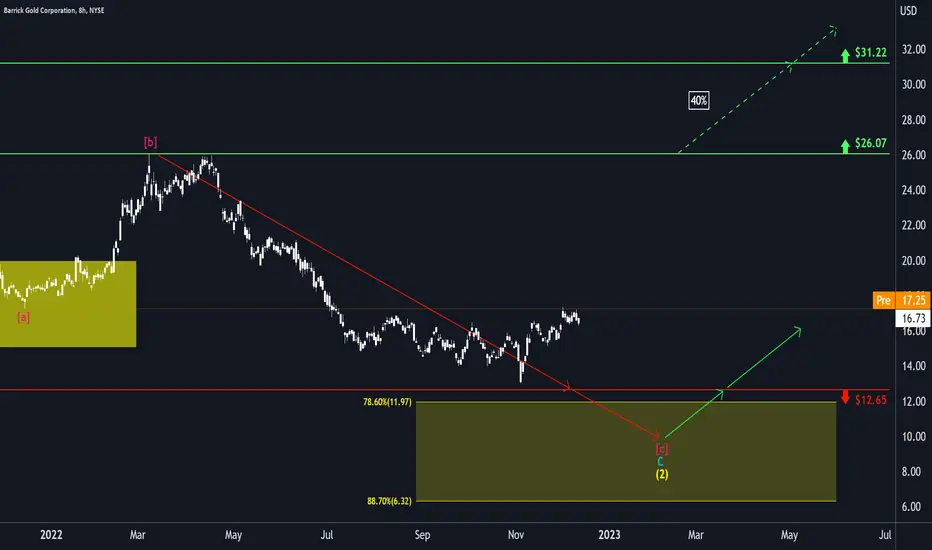
Although Barrick is currently showing some upwards tendencies, we're expecting the course to drop further below the support line around $12.65 to finish the yellow wave (2) within the yellow target zone, before heading above the $12.65-mark to carry on with an upwards trend. If Barrick urges to surpass the resistance line at $26.07, our alternative scenario will be activated, which would push the course even higher above the $31.22-mark.
📊 Free daily market insights combining macro + Elliott Wave analysis
🚀 Spot trends early with momentum, sentiment & price structure
🌐 Join thousands trading smarter - full free analyses at dailymarketupdate.com
🚀 Spot trends early with momentum, sentiment & price structure
🌐 Join thousands trading smarter - full free analyses at dailymarketupdate.com
Related publications
Disclaimer
The information and publications are not meant to be, and do not constitute, financial, investment, trading, or other types of advice or recommendations supplied or endorsed by TradingView. Read more in the Terms of Use.