Gold stabilized and rebounded on Tuesday (April 8), with an intraday increase of nearly 1%, successfully recovering the losses of the previous trading day. The rebound ended the three-day correction trend, and the gold price rebounded significantly from the key support level of $2,955. The current market focus is on the evolution of the Fed's policy path and the geopolitical trade situation. Under the interweaving of long and short factors, the short-term volatility of gold has risen significantly.
Fundamentals: The struggle between risk aversion and interest rate expectations
The rebound of gold at the beginning of this week was mainly driven by two factors:
1. The escalation of geopolitical trade risks
US President Trump's recent remarks on tariffs have triggered market concerns about the renewed tension in the global trade system.
2. The Fed's interest rate expectations fluctuated sharply
The interest rate futures market has undergone dramatic changes this week: On Monday, the market once bet that the Fed would cut interest rates five times in 2025, a significant shift from the expectation of "one or no interest rate cut" a week ago.
3. The coordination of the US dollar and capital flows
The US dollar index weakened slightly on Tuesday, reducing the cost of holding gold for non-US investors.
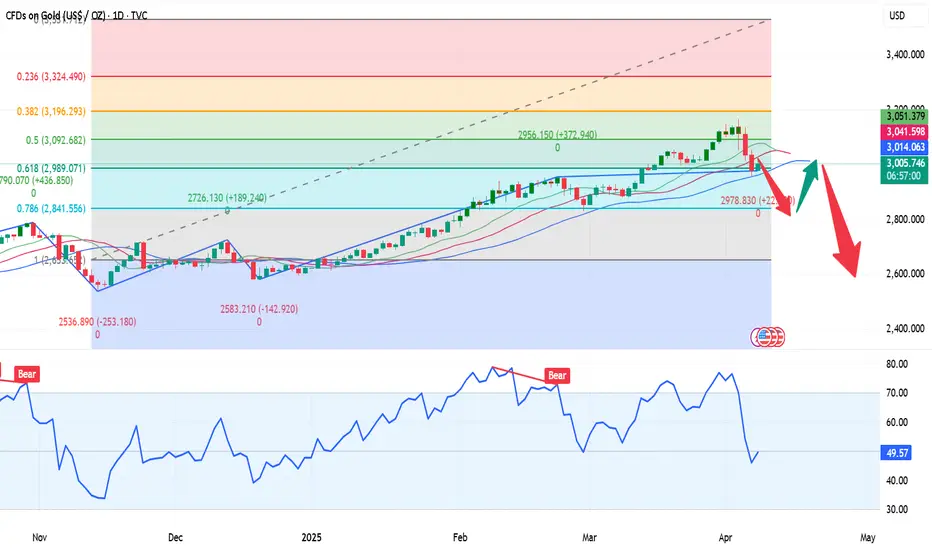
Technical aspect: Attack and defense of key support level
From the perspective of the market structure, the trend of gold this week showed typical "sharp drop and slow rise" characteristics:
Support confirmation: On Monday, the gold price accurately tested the support of $2955 and then rebounded. This position corresponds to the neckline of the platform that broke through in mid-March, and formed a double defense line with the 55-day moving average (US$2930). The intraday lows were densely bought, indicating that medium- and long-term investors viewed the correction as an opportunity to build positions.
Resistance distribution: The first resistance above is at US$3040 (daily line R1), and after breaking through, it may test US$3057 (March 20 pivot point) and US$3097 (R2). The historical high of US$3167 is still a psychological barrier, but it is difficult to challenge it directly in the short term.
In the short term, the trend of gold will depend on two major catalysts: 1. The minutes of the Fed's March meeting on Wednesday: If the minutes suggest an open attitude towards rate cuts, it may push gold prices to test the $3,050-3,070 range; conversely, if the emphasis is on inflation stickiness, it may trigger long profit-taking. 2. Progress in trade negotiations: Any substantive implementation or easing of tariff policies may trigger fluctuations of more than 5% in gold prices. In the medium term, the upward trend of gold has not been broken. Institutional research reports show that the current global central bank's demand for gold purchases is still at a historical high, and in the downward cycle of interest rates, the relative attractiveness of interest-free assets will continue to stand out. If the technical side breaks through $3,057, it will open up space for the impact of the previous high; the defense strength of the $2,950-2,930 area needs to be closely monitored below.
Fundamentals: The struggle between risk aversion and interest rate expectations
The rebound of gold at the beginning of this week was mainly driven by two factors:
1. The escalation of geopolitical trade risks
US President Trump's recent remarks on tariffs have triggered market concerns about the renewed tension in the global trade system.
2. The Fed's interest rate expectations fluctuated sharply
The interest rate futures market has undergone dramatic changes this week: On Monday, the market once bet that the Fed would cut interest rates five times in 2025, a significant shift from the expectation of "one or no interest rate cut" a week ago.
3. The coordination of the US dollar and capital flows
The US dollar index weakened slightly on Tuesday, reducing the cost of holding gold for non-US investors.
Technical aspect: Attack and defense of key support level
From the perspective of the market structure, the trend of gold this week showed typical "sharp drop and slow rise" characteristics:
Support confirmation: On Monday, the gold price accurately tested the support of $2955 and then rebounded. This position corresponds to the neckline of the platform that broke through in mid-March, and formed a double defense line with the 55-day moving average (US$2930). The intraday lows were densely bought, indicating that medium- and long-term investors viewed the correction as an opportunity to build positions.
Resistance distribution: The first resistance above is at US$3040 (daily line R1), and after breaking through, it may test US$3057 (March 20 pivot point) and US$3097 (R2). The historical high of US$3167 is still a psychological barrier, but it is difficult to challenge it directly in the short term.
In the short term, the trend of gold will depend on two major catalysts: 1. The minutes of the Fed's March meeting on Wednesday: If the minutes suggest an open attitude towards rate cuts, it may push gold prices to test the $3,050-3,070 range; conversely, if the emphasis is on inflation stickiness, it may trigger long profit-taking. 2. Progress in trade negotiations: Any substantive implementation or easing of tariff policies may trigger fluctuations of more than 5% in gold prices. In the medium term, the upward trend of gold has not been broken. Institutional research reports show that the current global central bank's demand for gold purchases is still at a historical high, and in the downward cycle of interest rates, the relative attractiveness of interest-free assets will continue to stand out. If the technical side breaks through $3,057, it will open up space for the impact of the previous high; the defense strength of the $2,950-2,930 area needs to be closely monitored below.
Trade active
In line with the trend, it is approaching the 55-day moving averageRelated publications
Disclaimer
The information and publications are not meant to be, and do not constitute, financial, investment, trading, or other types of advice or recommendations supplied or endorsed by TradingView. Read more in the Terms of Use.
Related publications
Disclaimer
The information and publications are not meant to be, and do not constitute, financial, investment, trading, or other types of advice or recommendations supplied or endorsed by TradingView. Read more in the Terms of Use.