https://tradingview.sweetlogin.com/x/YT8D31Fc/
💡Message Strategy
Market dehydration news:
1. On Wednesday, the Federal Open Market Committee (FOMC) maintained a stable stance on interest rates, maintaining them in the target range of 4.25% to 4.5%. The Fed expects to implement two rate cuts this year, but policymakers expect inflation to rise. They also lowered their outlook for gross domestic product (GDP).
2. After the Fed's decision was released, the spot gold price fell sharply from the level near $3,396 per ounce; during Powell's speech, the gold price accelerated its decline, once falling to around $3,362 per ounce.
3. Powell said that the current policy stance is ready for flexible response, "At present, we are in a good position to wait for more information about the possible direction of the economy before considering adjusting policies."
4. Powell pointed out that the Fed needs to further understand the current situation before considering adjusting monetary policy. He said that given the continued changes in trade, fiscal and regulatory policies, the Fed needs more time to assess their impact on the economy.
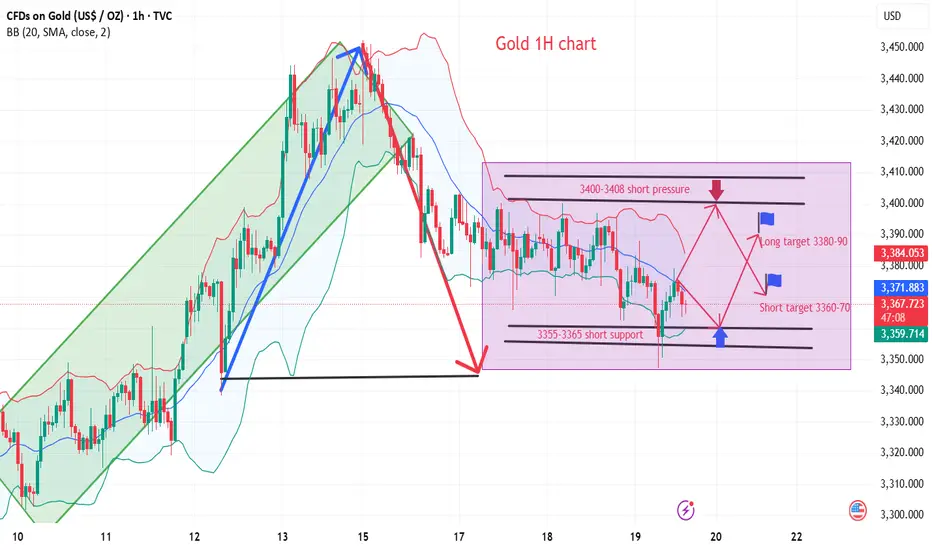
📊Technical aspects
On the 1H chart of gold, gold fell back from a two-month high, hitting a new low in a week, and the short-term trend is biased towards adjustment.
For the upper pressure of gold, pay attention to the intraday high point of gold price rebound at 3380-90 US dollars, which is also near the 5-day moving average of the daily line. Secondly, pay attention to the integer position of 3400 US dollars, which is also the high point of gold price rebound on Wednesday. For further strength, pay attention to the upper track of the daily Bollinger band at 3425 US dollars;
For the lower support of gold, pay attention to the intraday low of 3355-60 US dollars, which is the middle track position of the daily Bollinger band and near the weekly MA5 moving average. The 5-day moving average golden cross turns down, the MACD indicator is close to forming a slight dead cross, the KDJ indicator dead cross slows down, and the RSI indicator dead cross turns up. The short-term technical aspect shows that there is a risk of correction in gold prices.
💰Strategy Package
Short Position:3390-3400,SL:3410,Target: 3370-3360
Long Position:3355-3365,SL:3345,Target: 3380-3390
💡Message Strategy
Market dehydration news:
1. On Wednesday, the Federal Open Market Committee (FOMC) maintained a stable stance on interest rates, maintaining them in the target range of 4.25% to 4.5%. The Fed expects to implement two rate cuts this year, but policymakers expect inflation to rise. They also lowered their outlook for gross domestic product (GDP).
2. After the Fed's decision was released, the spot gold price fell sharply from the level near $3,396 per ounce; during Powell's speech, the gold price accelerated its decline, once falling to around $3,362 per ounce.
3. Powell said that the current policy stance is ready for flexible response, "At present, we are in a good position to wait for more information about the possible direction of the economy before considering adjusting policies."
4. Powell pointed out that the Fed needs to further understand the current situation before considering adjusting monetary policy. He said that given the continued changes in trade, fiscal and regulatory policies, the Fed needs more time to assess their impact on the economy.
📊Technical aspects
On the 1H chart of gold, gold fell back from a two-month high, hitting a new low in a week, and the short-term trend is biased towards adjustment.
For the upper pressure of gold, pay attention to the intraday high point of gold price rebound at 3380-90 US dollars, which is also near the 5-day moving average of the daily line. Secondly, pay attention to the integer position of 3400 US dollars, which is also the high point of gold price rebound on Wednesday. For further strength, pay attention to the upper track of the daily Bollinger band at 3425 US dollars;
For the lower support of gold, pay attention to the intraday low of 3355-60 US dollars, which is the middle track position of the daily Bollinger band and near the weekly MA5 moving average. The 5-day moving average golden cross turns down, the MACD indicator is close to forming a slight dead cross, the KDJ indicator dead cross slows down, and the RSI indicator dead cross turns up. The short-term technical aspect shows that there is a risk of correction in gold prices.
💰Strategy Package
Short Position:3390-3400,SL:3410,Target: 3370-3360
Long Position:3355-3365,SL:3345,Target: 3380-3390
Trade active
If there is no major event in the near future, gold will continue to fluctuate widely.Through scientific and rigorous financial analysis and personalized strategy formulation, we help you achieve stable growth of wealth. At the same time, in a complex and changing economic environment, we help you avoid potential risks and protect the saf
Related publications
Disclaimer
The information and publications are not meant to be, and do not constitute, financial, investment, trading, or other types of advice or recommendations supplied or endorsed by TradingView. Read more in the Terms of Use.
Through scientific and rigorous financial analysis and personalized strategy formulation, we help you achieve stable growth of wealth. At the same time, in a complex and changing economic environment, we help you avoid potential risks and protect the saf
Related publications
Disclaimer
The information and publications are not meant to be, and do not constitute, financial, investment, trading, or other types of advice or recommendations supplied or endorsed by TradingView. Read more in the Terms of Use.