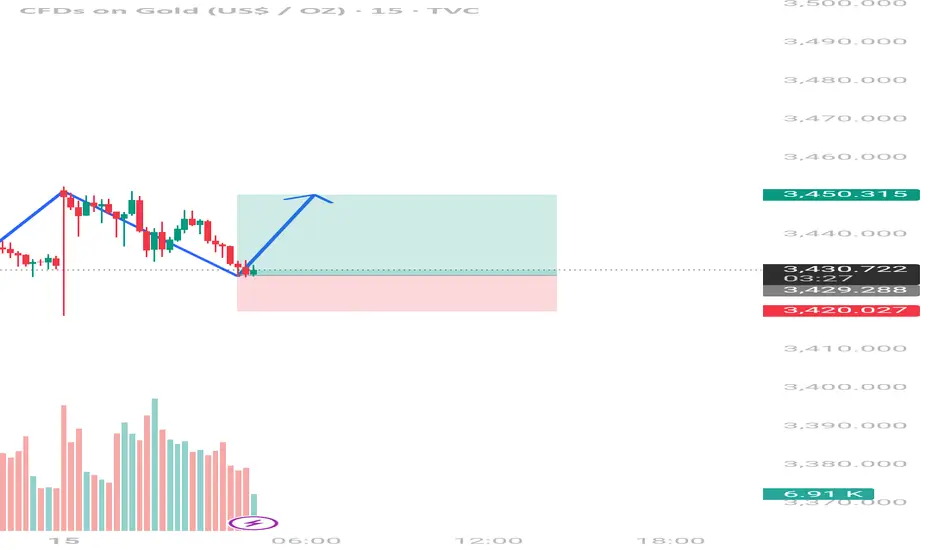
The chart you've shared is a 15-minute gold (XAU/USD) CFD trading chart, and it illustrates a bullish trade setup based on price action and possible harmonic or pattern-based analysis. Here's the breakdown of the idea:
---
📊 Trade Idea Overview:
Asset: Gold (XAU/USD)
Timeframe: 15-minute
Bias: Bullish (Buy/Long Setup)
---
🔍 Technical Details:
Pattern Observed: Possible double bottom or bullish corrective wave structure (Elliott Wave or ABC correction completion).
Entry Point: Around $3,430.40 (market price at time of setup).
Take Profit (TP): ~$3,450.31
Stop Loss (SL): ~$3,420.03
---
📐 Risk-to-Reward (R:R) Ratio:
Approximately 2:1, indicating a favorable reward relative to the risk.
---
📈 Rationale for Bullish Bias:
Price has completed a series of lower highs and lower lows (a corrective phase).
Price has bounced from a key support zone (~$3,429), suggesting buyers are stepping in.
The blue projection arrow indicates an expectation of upward continuation.
Volume is relatively steady with no significant bearish spike, supporting a potential reversal.
---
✅ Confirmation Indicators (Optional Additions):
You may want to look for:
Bullish candlestick patterns at the entry point (e.g., hammer, engulfing).
RSI divergence or bounce from oversold.
MACD crossover or histogram shift.
Trendline break confirmation on lower timeframes.
---
⚠️ Trade Management Tip:
Consider trailing your stop once price reaches halfway to TP.
Watch for reaction at interim resistance levels (e.g., $3,440 area).
---
Would you like me to generate a trade plan or script this into a trading journal format?
---
📊 Trade Idea Overview:
Asset: Gold (XAU/USD)
Timeframe: 15-minute
Bias: Bullish (Buy/Long Setup)
---
🔍 Technical Details:
Pattern Observed: Possible double bottom or bullish corrective wave structure (Elliott Wave or ABC correction completion).
Entry Point: Around $3,430.40 (market price at time of setup).
Take Profit (TP): ~$3,450.31
Stop Loss (SL): ~$3,420.03
---
📐 Risk-to-Reward (R:R) Ratio:
Approximately 2:1, indicating a favorable reward relative to the risk.
---
📈 Rationale for Bullish Bias:
Price has completed a series of lower highs and lower lows (a corrective phase).
Price has bounced from a key support zone (~$3,429), suggesting buyers are stepping in.
The blue projection arrow indicates an expectation of upward continuation.
Volume is relatively steady with no significant bearish spike, supporting a potential reversal.
---
✅ Confirmation Indicators (Optional Additions):
You may want to look for:
Bullish candlestick patterns at the entry point (e.g., hammer, engulfing).
RSI divergence or bounce from oversold.
MACD crossover or histogram shift.
Trendline break confirmation on lower timeframes.
---
⚠️ Trade Management Tip:
Consider trailing your stop once price reaches halfway to TP.
Watch for reaction at interim resistance levels (e.g., $3,440 area).
---
Would you like me to generate a trade plan or script this into a trading journal format?
Disclaimer
The information and publications are not meant to be, and do not constitute, financial, investment, trading, or other types of advice or recommendations supplied or endorsed by TradingView. Read more in the Terms of Use.
Disclaimer
The information and publications are not meant to be, and do not constitute, financial, investment, trading, or other types of advice or recommendations supplied or endorsed by TradingView. Read more in the Terms of Use.