The gold price peaked at the all-time high of 3,500 and then corrected to 3,120. After consecutive rallies, it faced resistance again at 3,452 due to the fading of market risk aversion. The week opened at around 3,433, hit a low of 3,340 on Friday, rebounded, and closed at around 3,368. The weekly candlestick closed bearish, but still above the 5-week moving average. The daily chart formed a doji star, with the candlestick pattern leaning bearish, while holding the middle 轨 (middle Bollinger Band) support. The 4-hour chart maintains an upward channel. As the market failed to break below the lower channel line this week, the downside space was not further opened. The price rebounded near the lower channel support at 3,340, showing temporary signs of stabilization. The short-term trend may continue to rebound, with key resistances at 3,380 and 3,404. If these resistances cannot be broken, the market will remain range-bound with a bearish bias. If broken upward, the bullish momentum of gold will truly emerge. Next week, if the opening strongly breaks through 3,380, we will go long on pullbacks. If there is no obvious change and it remains pressured at 3,380, we will continue to expect a decline.
you are currently struggling with losses,or are unsure which of the numerous trading strategies to follow,You have the option to join our VIP program. I will assist you and provide you with accurate trading signals, enabling you to navigate the financial markets with greater confidence and potentially achieve optimal trading results.
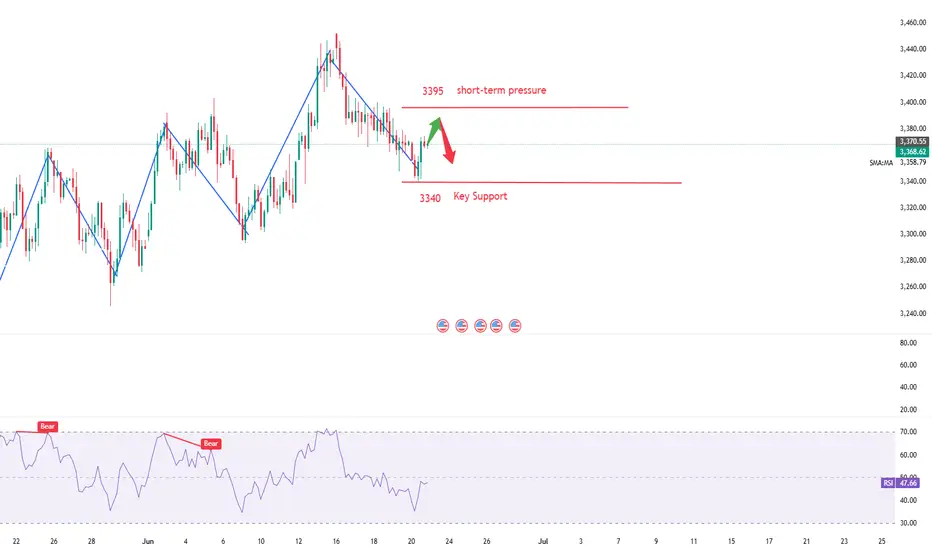
Trading Strategy:
sell@3390-3380
TP:3340-3350
you are currently struggling with losses,or are unsure which of the numerous trading strategies to follow,You have the option to join our VIP program. I will assist you and provide you with accurate trading signals, enabling you to navigate the financial markets with greater confidence and potentially achieve optimal trading results.
Trading Strategy:
sell@3390-3380
TP:3340-3350
Disclaimer
The information and publications are not meant to be, and do not constitute, financial, investment, trading, or other types of advice or recommendations supplied or endorsed by TradingView. Read more in the Terms of Use.
Disclaimer
The information and publications are not meant to be, and do not constitute, financial, investment, trading, or other types of advice or recommendations supplied or endorsed by TradingView. Read more in the Terms of Use.