technical analysis setup that highlights price action, support/resistance zones, and a probable price projection.
Key Observations:
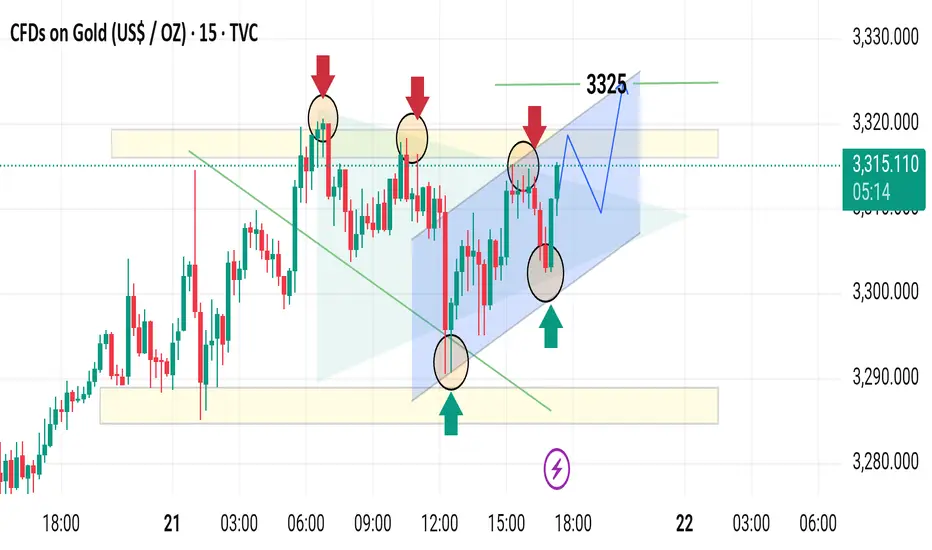
1. Resistance and Support Zones:
Yellow boxes represent supply and demand zones:
Upper box (3325–3320) is a resistance zone where price repeatedly reversed.
Lower box (3290–3285) is a support zone where price found buying interest.
2. Trend Pattern:
The chart illustrates a rising channel (blue area), indicating an upward trending market.
Price is making higher highs and higher lows, confirming the bullish channel.
3. Arrows and Circles:
Red arrows (top): Indicate price rejection or bearish reversal points (resistance).
Green arrows (bottom): Indicate bounce points or bullish reversal areas (support).
These areas correspond with the upper and lower boundaries of the blue rising channel.
4. Price Projection:
The projected path (blue zig-zag line) suggests:
A slight pullback within the channel.
Followed by a continuation toward the target of 3325, aligning with the upper resistance zone.
5. Volume/Volatility Indicator:
The purple lightning bolt symbol may suggest a news event or high volatility point, often important for intraday traders.
Summary:
The chart suggests a bullish bias for gold in the short term as it trades within an ascending channel. Price action indicates potential continuation toward the 3325 resistance level, provided the lower boundary of the channel and the ~3,300 support hold.
Key Observations:
1. Resistance and Support Zones:
Yellow boxes represent supply and demand zones:
Upper box (3325–3320) is a resistance zone where price repeatedly reversed.
Lower box (3290–3285) is a support zone where price found buying interest.
2. Trend Pattern:
The chart illustrates a rising channel (blue area), indicating an upward trending market.
Price is making higher highs and higher lows, confirming the bullish channel.
3. Arrows and Circles:
Red arrows (top): Indicate price rejection or bearish reversal points (resistance).
Green arrows (bottom): Indicate bounce points or bullish reversal areas (support).
These areas correspond with the upper and lower boundaries of the blue rising channel.
4. Price Projection:
The projected path (blue zig-zag line) suggests:
A slight pullback within the channel.
Followed by a continuation toward the target of 3325, aligning with the upper resistance zone.
5. Volume/Volatility Indicator:
The purple lightning bolt symbol may suggest a news event or high volatility point, often important for intraday traders.
Summary:
The chart suggests a bullish bias for gold in the short term as it trades within an ascending channel. Price action indicates potential continuation toward the 3325 resistance level, provided the lower boundary of the channel and the ~3,300 support hold.
Trade active
Trade closed: target reached
t.me/htGGOLD_SOUK_Trd
🟢All Pairs Signals Provided
🟡XAUUSD AND CRYPTO
✅Just Register now and Enjoy
✅No swap & No commission
one.exnesstrack.org/a/siuhoykv4s
🟢All Pairs Signals Provided
🟡XAUUSD AND CRYPTO
✅Just Register now and Enjoy
✅No swap & No commission
one.exnesstrack.org/a/siuhoykv4s
Disclaimer
The information and publications are not meant to be, and do not constitute, financial, investment, trading, or other types of advice or recommendations supplied or endorsed by TradingView. Read more in the Terms of Use.