Gold/Silver ratio represents the appetite for risk
Stronger gold means risk off and vice versa
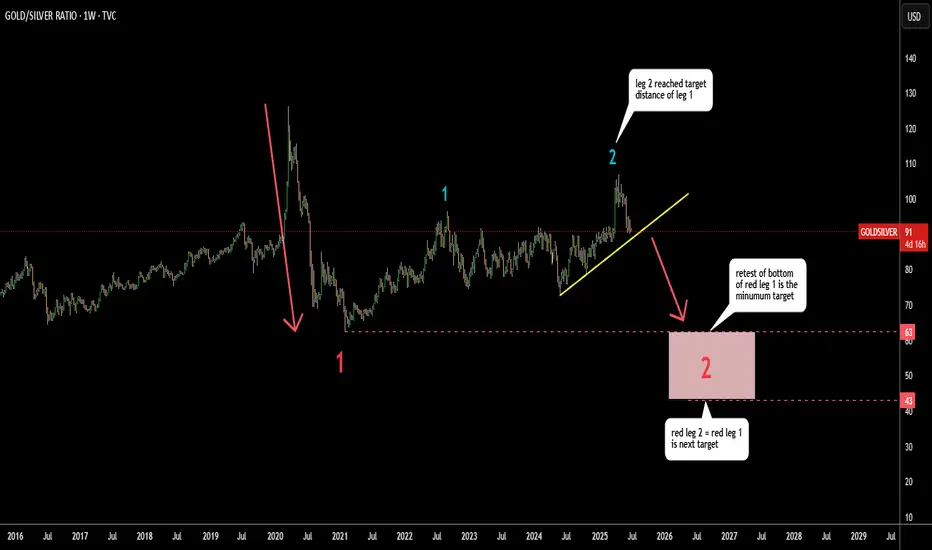
In spring, the ratio had hit the target for leg 2 (blue) within
large consolidation that took over 4 years to emerge
It travelled the equal distance of leg 1 (blue) and then reversed.
The next step might be the continuation to the downside for the ratio.
The minimum target is to hit the bottom of red leg 1 at 63.
The next target is located at the distance of the red leg 1 subtracted from the peak of blue leg 2. It was set at 43.
Both downside targets are within historical range.
Gold/Copper ratio shows same dynamics of "Risk-On" attitude on the market.
Stronger gold means risk off and vice versa
In spring, the ratio had hit the target for leg 2 (blue) within
large consolidation that took over 4 years to emerge
It travelled the equal distance of leg 1 (blue) and then reversed.
The next step might be the continuation to the downside for the ratio.
The minimum target is to hit the bottom of red leg 1 at 63.
The next target is located at the distance of the red leg 1 subtracted from the peak of blue leg 2. It was set at 43.
Both downside targets are within historical range.
Gold/Copper ratio shows same dynamics of "Risk-On" attitude on the market.
Disclaimer
The information and publications are not meant to be, and do not constitute, financial, investment, trading, or other types of advice or recommendations supplied or endorsed by TradingView. Read more in the Terms of Use.
Disclaimer
The information and publications are not meant to be, and do not constitute, financial, investment, trading, or other types of advice or recommendations supplied or endorsed by TradingView. Read more in the Terms of Use.