This Looks So Bullish (I See A Cup And Handle. What do you see?)
Pattern Identified: Cup and Handle
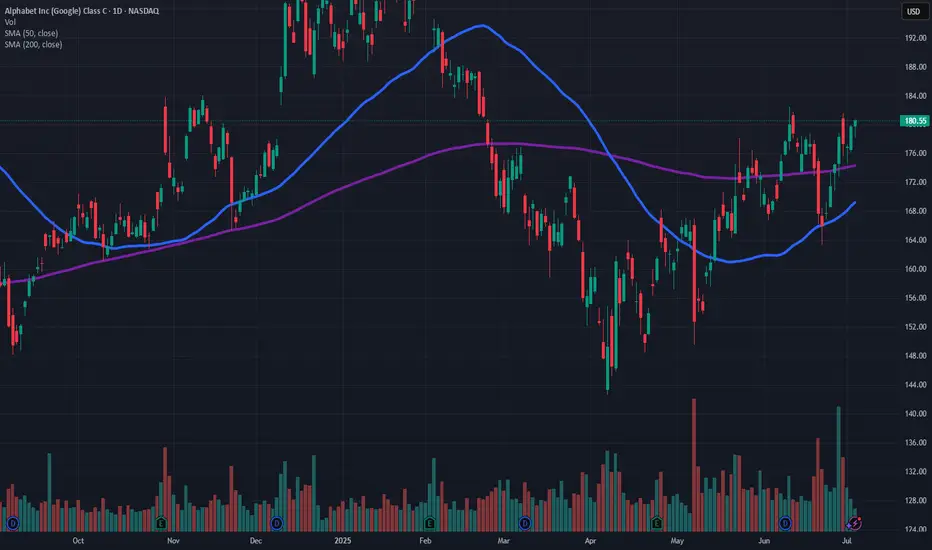
From the chart of Alphabet Inc. (GOOGL), the most prominent and likely bullish pattern is a Cup and Handle formation:
Cup Formation:
The price declines sharply around February–April 2025.
It then forms a rounded bottom.
Recovers back to the previous resistance near $180 in June–July.
Handle Formation:
A short pullback (forming a small downward-sloping consolidation).
Followed by a breakout around $180.55 (current price).
Price Target Calculation:
Formula:
Target Price = Breakout Level+(Cup Height)
Breakout Level: ~$180
Cup Bottom: ~$145
Cup Height: 180 - 145 = $35
Target Price = 180+35 = 215
Trade active
For more detailed technical and fundamental analysis, subscribe to my free newsletter . The newsletter link is in my profile.I publish the newsletter one per week. Every Sunday it lands into your inbox for you to be ready for the next stock market open day.
Disclaimer
The information and publications are not meant to be, and do not constitute, financial, investment, trading, or other types of advice or recommendations supplied or endorsed by TradingView. Read more in the Terms of Use.
Disclaimer
The information and publications are not meant to be, and do not constitute, financial, investment, trading, or other types of advice or recommendations supplied or endorsed by TradingView. Read more in the Terms of Use.