Technical Analysis (30-Minute Chart and 1-Hour Chart)
* Trend and Price Action:
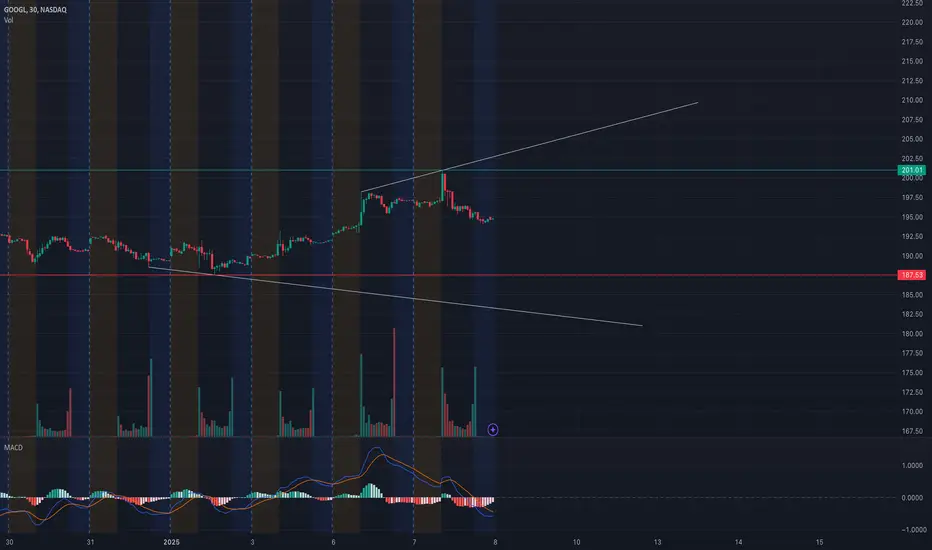
* On the 30-minute chart, GOOGL is in a consolidation phase after a strong upward move, forming a flag-like pattern.
* On the 1-hour chart, the price has pulled back from its recent highs near $202.50 and is finding support near $194.87.
* Volume: Declining volume during the pullback indicates the selling pressure may be losing momentum, which aligns with the possibility of a continuation of the prior bullish trend.
* Indicators:
* MACD: Shows signs of a potential bearish crossover, reflecting decreasing momentum but not yet confirmed.
* Stochastic RSI: Near oversold levels, indicating a potential reversal or consolidation phase.
* Key Levels:
* Support Levels:
* $194.87: Immediate support; breaking below this level could lead to a retest of $190.00.
* $187.50: A significant support level, with GEX data indicating strong PUT activity.
* Resistance Levels:
* $202.50: Immediate resistance; aligns with prior highs and a CALL wall.
* $205.00-$210.00: Extended resistance cluster with notable CALL interest.
GEX Insights for GOOGL
* Gamma Exposure (GEX):
* Positive GEX Zones:
* $202.50: Key CALL wall, acting as a strong resistance zone for upside movement.
* $205.00: Significant CALL wall, with additional resistance near $210.00, signaling heightened seller interest at higher levels.
* Negative GEX Zones:
* $194.00-$192.00: Heavy PUT concentration, indicating a critical support cluster.
* Below $190.00: Negative gamma exposure increases, suggesting higher volatility.
* Options Metrics:
* IVR (Implied Volatility Rank): 59%, indicating moderately elevated options pricing.
* Options Flow:
* CALLs: Dominant near $202.50 and $205.00, reflecting potential resistance at these levels.
* PUTs: Concentrated below $195, with heavy protective positioning at $190 and $187.50.
Trade Scenarios:
Bullish Scenario:
* Entry: Above $195.50 with confirmation of buying momentum.
* Target: $202.50 (initial), $205.00 (extended).
* Stop-Loss: Below $194.00 to limit downside risk.
Bearish Scenario:
* Entry: Below $194.00 with strong selling volume.
* Target: $190.00 (initial), $187.50 (extended).
* Stop-Loss: Above $195.50 to cap losses.
Conclusion
GOOGL is consolidating near $195, with $202.50 acting as a critical resistance zone. A break above $202.50 could trigger further bullish momentum, while a breakdown below $194 could lead to increased selling pressure toward $190 or lower. GEX data confirms these levels as pivotal for directional movement.
Disclaimer: This analysis is for educational purposes only and does not constitute financial advice. Always conduct your own research and manage risk responsibly.
Let me know if you need additional insights or refinements!
Disclaimer
The information and publications are not meant to be, and do not constitute, financial, investment, trading, or other types of advice or recommendations supplied or endorsed by TradingView. Read more in the Terms of Use.
Disclaimer
The information and publications are not meant to be, and do not constitute, financial, investment, trading, or other types of advice or recommendations supplied or endorsed by TradingView. Read more in the Terms of Use.