5 days before earnings, a bold call... or is it.
On October 22nd, morningstar.com a leading provider of independent investment insights with 10.9 million subscribers said:
“With its 4-star rating, we believe Alphabet’s stock is undervalued compared with our long-term fair value estimate of $209 per share”
source: tinyurl.com/mrx2pf54
Meanwhile on October 23rd Without Worries with his 14k followers says.. a 40% correction to $100 is probable.
Why bearish?
Before the TA, there be some fundamentals to consider. I’m sure it cannot escaped your attention that Google has become a platform for your attention rather a provider of results. Advertisements plaster the screen to most search enquires.
Mr Who the Boss “Why Google search is falling apart” makes an excellent deep dive: tinyurl.com/3fx52wcw
The TA
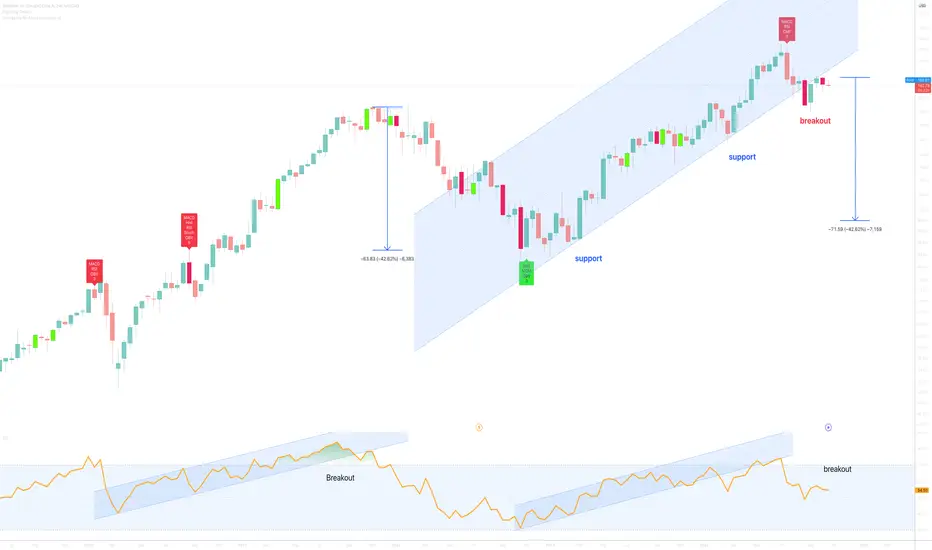
On the 2 week chart above:
1) Price action and RSI support fails.
2) Regular bearish divergence, as measured over several months.
3) Uptrend channel breakdown with confirmation. This forecast projects price action to correct circa 40% to $96.
4) The 3 month chart (below). Can’t ignore this beautiful signal. This candle is named as the “hanging man”, it is an indication of exhausted buyers. This should not be surprising after 6 straight green quarterly candles. It is fairly obvious what should now occur, look left.
Is it possible price action continues to grow? Sure.
Is it probable? No.
Ww
3 month hanging man candle

On October 22nd, morningstar.com a leading provider of independent investment insights with 10.9 million subscribers said:
“With its 4-star rating, we believe Alphabet’s stock is undervalued compared with our long-term fair value estimate of $209 per share”
source: tinyurl.com/mrx2pf54
Meanwhile on October 23rd Without Worries with his 14k followers says.. a 40% correction to $100 is probable.
Why bearish?
Before the TA, there be some fundamentals to consider. I’m sure it cannot escaped your attention that Google has become a platform for your attention rather a provider of results. Advertisements plaster the screen to most search enquires.
Mr Who the Boss “Why Google search is falling apart” makes an excellent deep dive: tinyurl.com/3fx52wcw
The TA
On the 2 week chart above:
1) Price action and RSI support fails.
2) Regular bearish divergence, as measured over several months.
3) Uptrend channel breakdown with confirmation. This forecast projects price action to correct circa 40% to $96.
4) The 3 month chart (below). Can’t ignore this beautiful signal. This candle is named as the “hanging man”, it is an indication of exhausted buyers. This should not be surprising after 6 straight green quarterly candles. It is fairly obvious what should now occur, look left.
Is it possible price action continues to grow? Sure.
Is it probable? No.
Ww
3 month hanging man candle
Note
Had a message or two asking if this idea is active. No, it isn't.Price action is oversold at the moment, everyone is bearish. That is not the moment to be short, hip deep in Long Put options...
Wait for a resistance backtest confirmation, expected as the summer months approach. Probably after 90 days! You know when the EU starts taxing online US services... only a matter of time.
BTC
bc1q2eckdzh0q8vsd7swcc8et6ze7s99khhxyl7zwy
Weblink: patreon.com/withoutworries
Allow 3-6 months on ideas. Not investment advice. DYOR
bc1q2eckdzh0q8vsd7swcc8et6ze7s99khhxyl7zwy
Weblink: patreon.com/withoutworries
Allow 3-6 months on ideas. Not investment advice. DYOR
Disclaimer
The information and publications are not meant to be, and do not constitute, financial, investment, trading, or other types of advice or recommendations supplied or endorsed by TradingView. Read more in the Terms of Use.