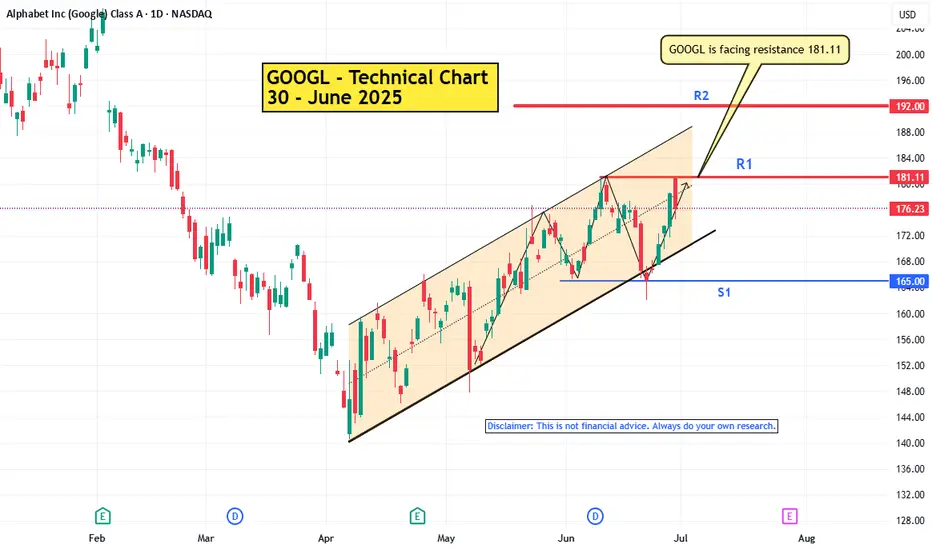
Google is in uptrend. Currently it is facing the resistance 181.11.
It has slightly pull backed from the resistance.
Pattern : Ascending channel - a bullish chart pattern. To valid this pattern the price has to consistently make higher highs and higher lows. But the price is now facing the resistance 181.11 To make higher high it has to break it.
If it fails to break the resistance , sideways trend may be seen here for short period of time and bullish momentum may become weak.
Note :
If you’re interested in receiving detailed technical analysis reports on your selected stocks, feel free to reach out to me. I can provide you with customized reports covering trends, key levels, momentum, patterns, and price projections to support your trading or investment decisions.
Related publications
Disclaimer
The information and publications are not meant to be, and do not constitute, financial, investment, trading, or other types of advice or recommendations supplied or endorsed by TradingView. Read more in the Terms of Use.
Related publications
Disclaimer
The information and publications are not meant to be, and do not constitute, financial, investment, trading, or other types of advice or recommendations supplied or endorsed by TradingView. Read more in the Terms of Use.