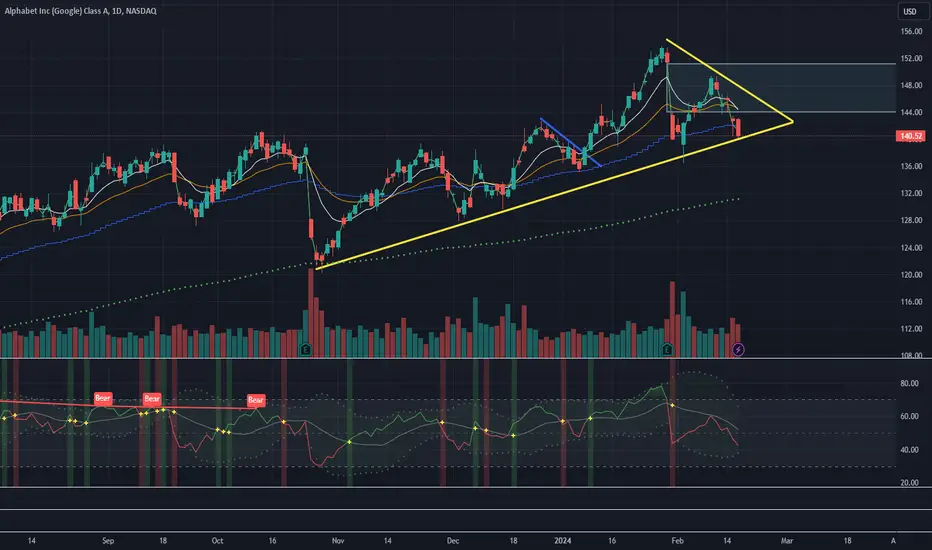
This chart is interesting because as you can see  GOOGL has had a STRONG uptrend and continues to respect the trendline over time. on the other side we see that we have weakness in the near term and have breached the 50ema and the shorter term EMAs have crossed. If the trendline is broken we can look to short under $139, if we see a bounce materialize here and we break the immediate downward trendline then we can look to go long safely over $145.
Trade SAFE!
Trade SAFE!
Note
approaching our Long entry of $145Trade active
This has broken the upward trend line and we look to take this short with a stop around 143Trade closed manually
Closed this down here as we got a buy signal on the daily. could be a potential reversion trade from here“You have power over your mind – not outside events. Realize this, and you will find strength.“
-Trade Daddy
-Trade Daddy
Disclaimer
The information and publications are not meant to be, and do not constitute, financial, investment, trading, or other types of advice or recommendations supplied or endorsed by TradingView. Read more in the Terms of Use.
“You have power over your mind – not outside events. Realize this, and you will find strength.“
-Trade Daddy
-Trade Daddy
Disclaimer
The information and publications are not meant to be, and do not constitute, financial, investment, trading, or other types of advice or recommendations supplied or endorsed by TradingView. Read more in the Terms of Use.