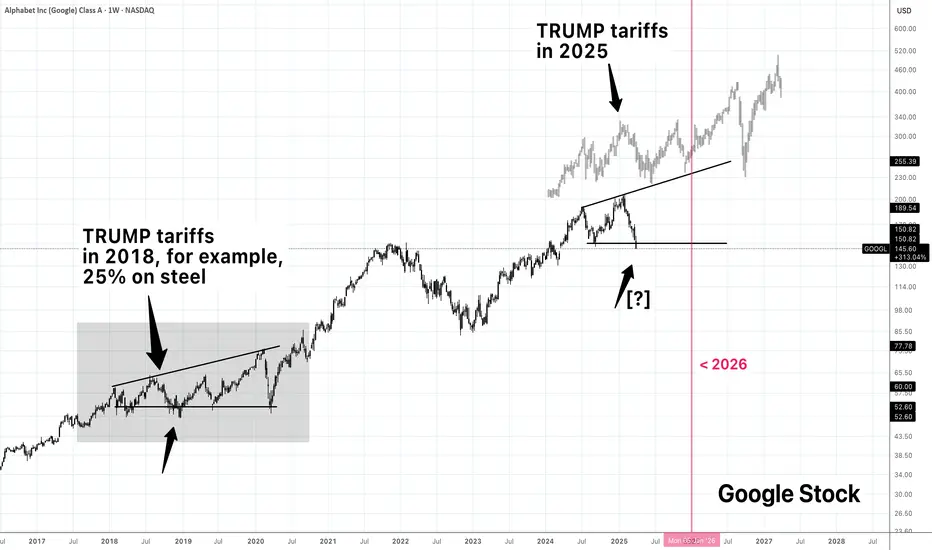
Based on the Google stock chart, I believe that large corporations reflect the overall economy more than their individual financial strength.
History:
January 2018: The U.S. imposed tariffs ranging from 30% to 50% on imported solar panels and washing machines. 
March 2018: Tariffs of 25% on steel and 10% on aluminum imports were enacted, citing national security concerns. 
June 2018: The steel and aluminum tariffs were extended to include imports from the European Union, Canada, and Mexico.
July 2018: The U.S. imposed a 25% tariff on $34 billion worth of Chinese goods, initiating a trade conflict with China. 
August 2018: An additional 25% tariff was applied to another $16 billion of Chinese imports.
September 2018: The administration implemented a 10% tariff on $200 billion worth of Chinese goods, with plans to increase it to 25% by January 2019. 
May 2019: The tariff on the $200 billion of Chinese goods was increased from 10% to 25% after trade negotiations stalled.
August 2019: President Trump announced plans for a 10% tariff on an additional $300 billion of Chinese goods, which were later adjusted, with some products facing a 15% tariff starting in September 2019 and others delayed to December 2019.
Disclaimer
The information and publications are not meant to be, and do not constitute, financial, investment, trading, or other types of advice or recommendations supplied or endorsed by TradingView. Read more in the Terms of Use.
Disclaimer
The information and publications are not meant to be, and do not constitute, financial, investment, trading, or other types of advice or recommendations supplied or endorsed by TradingView. Read more in the Terms of Use.