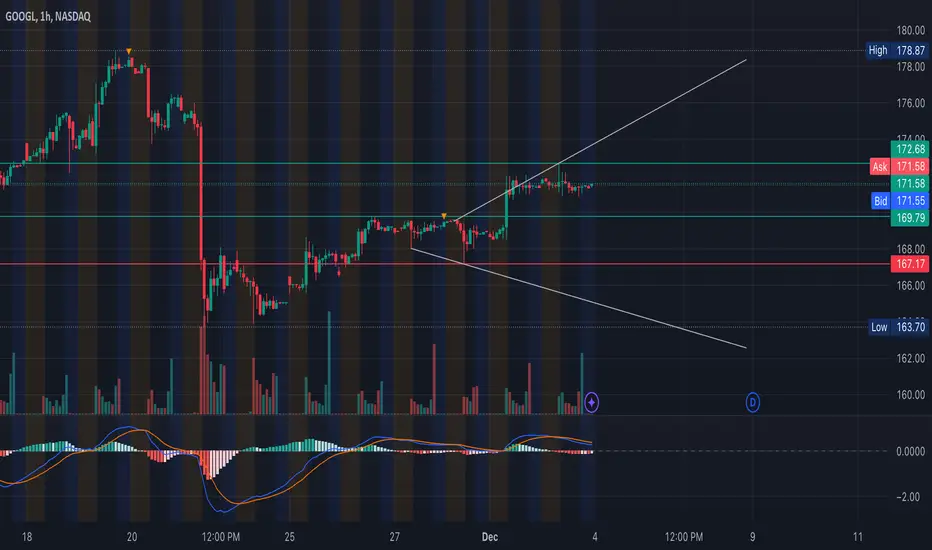
GOOGL is trading in a tightening range, testing a significant resistance zone. With recent price consolidation and volume spikes, here's how to navigate potential breakout or rejection scenarios.
1️⃣ Price Action & Chart Analysis
* Trend Overview: GOOGL is hovering below a key resistance at $172.68 after rebounding from support at $167.
* Key Levels:
* Resistance: $172.68
* Support: $168.00 and $167.17
The $171–$172 range will be crucial for determining the stock's next move.
2️⃣ Liquidity Zones & Order Blocks
* Liquidity Zone: The area between $171 and $172 is attracting activity; watch for increased volume here.
* Order Block: Demand zone around $167, which aligns with previous buying interest and consolidation.
3️⃣ Scalping Strategy
For quick intraday trades:
* Entry (Breakout): Buy above $172.68 with confirmation. Target $174–$175 for a quick exit.
* Stop-Loss: Place below $171 to manage risk.
* Rejection Play: If $172.68 holds as resistance, short with a target of $169.
4️⃣ Swing Trade Strategy
For traders looking for a longer-term position:
* Entry Option 1: Buy on a confirmed breakout above $172.68.
* Entry Option 2: Wait for a pullback to $167 for a better risk-reward ratio.
* Targets:
* Initial Target: $175
* Extended Target: $178
* Stop-Loss: Below $166 for a conservative risk approach.
5️⃣ Momentum & Indicators
* MACD: Bullish momentum building, with the signal line trending upwards.
* Volume: Spikes at resistance indicate trader interest; watch for sustained buying to confirm a breakout.
Game Plan for Tomorrow
* Scenario 1: A breakout above $172.68 sets up a move toward $175; wait for strong volume before entering.
* Scenario 2: Failure to break $172.68 could lead to a pullback to $167, offering a better entry for long positions.
Disclaimer:
This analysis is for educational purposes only and not financial advice. Always do your own due diligence before making trades.
Disclaimer
The information and publications are not meant to be, and do not constitute, financial, investment, trading, or other types of advice or recommendations supplied or endorsed by TradingView. Read more in the Terms of Use.
Disclaimer
The information and publications are not meant to be, and do not constitute, financial, investment, trading, or other types of advice or recommendations supplied or endorsed by TradingView. Read more in the Terms of Use.