Technical Analysis Overview:
1. Market Structure:
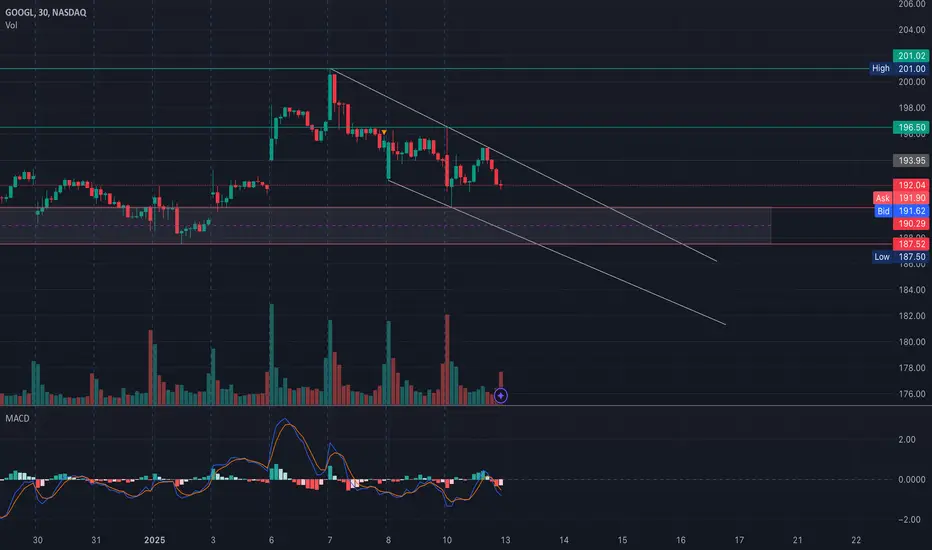
* GOOGL is currently trading within a descending channel, indicating bearish pressure.
* Key levels include resistance at $196.50 and support at $187.50, with price moving closer to the lower support region.
2. Supply and Demand Zones:
* Demand Zone: $187.50 - $190.00 (highlighted by the significant GEX PUT support).
* Supply Zone: $196.50 - $200.00 (strong gamma resistance evident from GEX analysis).
3. Key Levels to Watch:
* Resistance Levels: $196.50, $200.00 (psychological and technical resistance).
* Support Levels: $191.00, $187.50 (key downside protection levels).
4. Volume and MACD Analysis:
* The MACD is showing bearish momentum, with the histogram trending downward.
* Recent volume spikes near $191 suggest heightened selling pressure, aligning with the bearish trend.
5. Trendline and EMA Analysis:
* Price is firmly below the 9 EMA and 21 EMA, confirming a bearish sentiment in the short term.
* A breakout above $196.50 would indicate a potential trend reversal; otherwise, the bearish channel will likely persist.
6. Stoch RSI:
* Currently oversold, suggesting a potential relief rally. However, confirmation from price action is essential before acting on it.
GEX Analysis for Options Trading:

1. Gamma Levels:
* Call Wall at $200.00: Strong resistance due to significant positive NETGEX.
* Put Wall at $187.50: Strong support reinforced by substantial negative NETGEX.
2. Options Flow and Sentiment:
* IVR: 62.2 indicates high implied volatility, favoring premium-selling strategies.
* Call/Put Ratio: Slight bearish bias, supported by the heavier concentration of PUT walls below the current price.
Actionable Trade Setups:
1. Bullish Setup:
* Entry: Above $196.50 with strong volume.
* Target: $200.00.
* Stop-Loss: Below $194.00.
2. Bearish Setup:
* Entry: Below $190.00 with confirmed selling pressure.
* Target: $187.50, $185.00.
* Stop-Loss: Above $192.00.
Options Strategy Recommendations:
1. Bullish Strategy:
* Buy Call Spread: $195/$200 expiring in 2 weeks.
* Rationale: Capture potential upside toward $200.
* Risk: Limited to the premium paid.
2. Bearish Strategy:
* Buy Put Spread: $190/$185 expiring in 2 weeks.
* Rationale: Capitalize on a potential move toward $185.
* Risk: Limited to the premium paid.
3. Neutral Strategy:
* Iron Condor: Sell $200 Call and $185 Put, buy further OTM legs for protection.
* Rationale: Profit from consolidation between $185 and $200.
* Risk: Defined by the width of the wings.
Thoughts on Market Direction:
* Current Market Sentiment:
* The broader market appears to be leaning bearish, with selling pressure evident across major tech stocks. GOOGL is no exception, maintaining its descent within the bearish channel.
* If the broader indices such as NASDAQ show a strong recovery, GOOGL might attempt a reversal above $196.50.
* Market Risk:
* With high implied volatility (IVR 62.2) and bearish options flow, the likelihood of GOOGL testing its lower support levels at $187.50 is higher.
* However, traders should remain cautious of any gap-up or gap-down price action during the pre-market session, as this could disrupt existing setups.
Important Reminder for Traders:
* Check Pre-Market Price Action:
* Price might gap up or down at the market open, which could impact key support/resistance levels. Reassess price action and confirm setups before entering trades.
* Questions? Contact Me Directly:
* If you have any questions or need further clarification, feel free to reach out for support.
Conclusion:
GOOGL remains bearish with strong resistance at $196.50 and support at $187.50. Traders should closely monitor pre-market movements and broader market sentiment to refine their entries and exits. Employ a disciplined approach with tight stop-losses to manage risk effectively.
Disclaimer: This analysis is for educational purposes only. Always perform your due diligence and manage your risks before trading.
1. Market Structure:
* GOOGL is currently trading within a descending channel, indicating bearish pressure.
* Key levels include resistance at $196.50 and support at $187.50, with price moving closer to the lower support region.
2. Supply and Demand Zones:
* Demand Zone: $187.50 - $190.00 (highlighted by the significant GEX PUT support).
* Supply Zone: $196.50 - $200.00 (strong gamma resistance evident from GEX analysis).
3. Key Levels to Watch:
* Resistance Levels: $196.50, $200.00 (psychological and technical resistance).
* Support Levels: $191.00, $187.50 (key downside protection levels).
4. Volume and MACD Analysis:
* The MACD is showing bearish momentum, with the histogram trending downward.
* Recent volume spikes near $191 suggest heightened selling pressure, aligning with the bearish trend.
5. Trendline and EMA Analysis:
* Price is firmly below the 9 EMA and 21 EMA, confirming a bearish sentiment in the short term.
* A breakout above $196.50 would indicate a potential trend reversal; otherwise, the bearish channel will likely persist.
6. Stoch RSI:
* Currently oversold, suggesting a potential relief rally. However, confirmation from price action is essential before acting on it.
GEX Analysis for Options Trading:
1. Gamma Levels:
* Call Wall at $200.00: Strong resistance due to significant positive NETGEX.
* Put Wall at $187.50: Strong support reinforced by substantial negative NETGEX.
2. Options Flow and Sentiment:
* IVR: 62.2 indicates high implied volatility, favoring premium-selling strategies.
* Call/Put Ratio: Slight bearish bias, supported by the heavier concentration of PUT walls below the current price.
Actionable Trade Setups:
1. Bullish Setup:
* Entry: Above $196.50 with strong volume.
* Target: $200.00.
* Stop-Loss: Below $194.00.
2. Bearish Setup:
* Entry: Below $190.00 with confirmed selling pressure.
* Target: $187.50, $185.00.
* Stop-Loss: Above $192.00.
Options Strategy Recommendations:
1. Bullish Strategy:
* Buy Call Spread: $195/$200 expiring in 2 weeks.
* Rationale: Capture potential upside toward $200.
* Risk: Limited to the premium paid.
2. Bearish Strategy:
* Buy Put Spread: $190/$185 expiring in 2 weeks.
* Rationale: Capitalize on a potential move toward $185.
* Risk: Limited to the premium paid.
3. Neutral Strategy:
* Iron Condor: Sell $200 Call and $185 Put, buy further OTM legs for protection.
* Rationale: Profit from consolidation between $185 and $200.
* Risk: Defined by the width of the wings.
Thoughts on Market Direction:
* Current Market Sentiment:
* The broader market appears to be leaning bearish, with selling pressure evident across major tech stocks. GOOGL is no exception, maintaining its descent within the bearish channel.
* If the broader indices such as NASDAQ show a strong recovery, GOOGL might attempt a reversal above $196.50.
* Market Risk:
* With high implied volatility (IVR 62.2) and bearish options flow, the likelihood of GOOGL testing its lower support levels at $187.50 is higher.
* However, traders should remain cautious of any gap-up or gap-down price action during the pre-market session, as this could disrupt existing setups.
Important Reminder for Traders:
* Check Pre-Market Price Action:
* Price might gap up or down at the market open, which could impact key support/resistance levels. Reassess price action and confirm setups before entering trades.
* Questions? Contact Me Directly:
* If you have any questions or need further clarification, feel free to reach out for support.
Conclusion:
GOOGL remains bearish with strong resistance at $196.50 and support at $187.50. Traders should closely monitor pre-market movements and broader market sentiment to refine their entries and exits. Employ a disciplined approach with tight stop-losses to manage risk effectively.
Disclaimer: This analysis is for educational purposes only. Always perform your due diligence and manage your risks before trading.
Disclaimer
The information and publications are not meant to be, and do not constitute, financial, investment, trading, or other types of advice or recommendations supplied or endorsed by TradingView. Read more in the Terms of Use.
Disclaimer
The information and publications are not meant to be, and do not constitute, financial, investment, trading, or other types of advice or recommendations supplied or endorsed by TradingView. Read more in the Terms of Use.