📈 Alphabet Inc. (GOOGL) – Multi-Year Fibonacci Expansion Outlook
Timeframe: 1M | Horizon: 2025–2027
🔍 Technical Overview
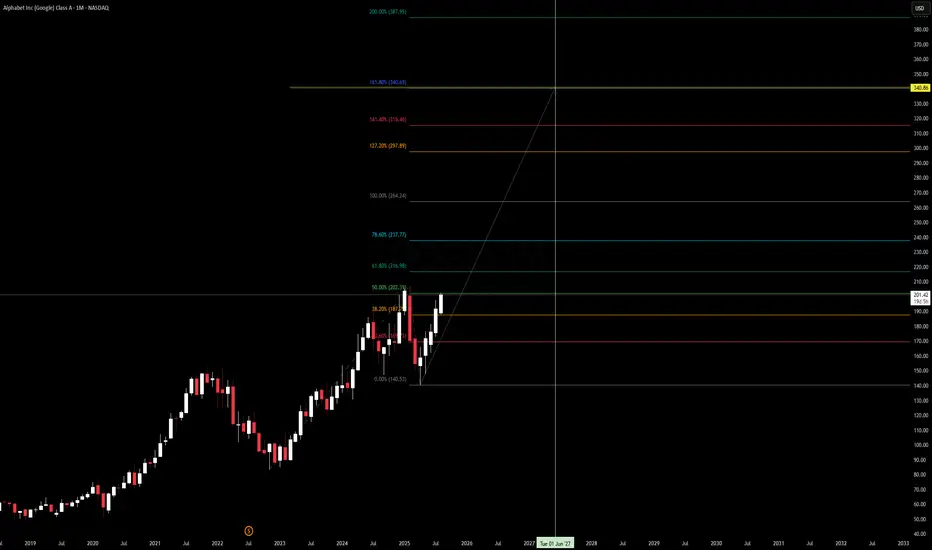
Alphabet (GOOGL) has maintained a strong monthly uptrend after reclaiming the 50% Fibonacci retracement at $202.39. Price action is showing higher lows since late 2022, signaling accumulation and long-term institutional positioning.
Key Fibonacci levels plotted from the 2022 low to the 2025 projected swing high suggest:
61.8%: $216.98 – Key breakout confirmation level.
78.6%: $237.77 – Strong resistance zone, potential partial profit area.
100%: $264.24 – Medium-term bullish target.
127.2%: $297.89 – First major expansion target into 2026.
161.8%: $340.69 – High-probability target for late 2026/early 2027 if macro tailwinds remain.
200%: $387.95 – Stretch target under euphoric conditions.
📊 Macro & Fundamental Context
Earnings Resilience – Alphabet continues to deliver double-digit revenue growth, fueled by Search, YouTube, and Google Cloud. Margins remain robust despite AI-driven capex expansion.
AI Adoption Cycle – Integration of Gemini AI across Search and Workspace could unlock significant incremental revenue and defend market share from competitors like MSFT/OpenAI.
Digital Ad Market Recovery – Global ad spend is rebounding as consumer confidence stabilizes; this benefits Alphabet’s core segments disproportionately.
Rate Policy Shift – With the Fed pivoting towards a neutral-to-dovish stance in late 2025 projections, mega-cap growth valuations may expand further.
📅 Outlook & Targets (24-Month Horizon)
Base Case: $264.24 by mid-2026 (+31% from current levels).
Bull Case: $297.89–$340.69 by late 2026 to early 2027 (+48%–69%).
Bear Case: Failure to hold $187 support could revisit $167–$140 range.
⚠ Risk Factors
Regulatory pressures in the U.S. and EU targeting antitrust and advertising models.
AI monetization lag versus expectations.
Macro shocks (geopolitical, recessionary) compressing tech multiples.
📝 Trading Plan (Not Financial Advice)
I’m watching the $216–$218 zone closely — a clean monthly close above here strengthens the path toward $237 and beyond. Pullbacks toward $187–$190 could be attractive for positioning, provided macro data supports risk-on sentiment.
📌 Disclaimer:
This analysis is for educational purposes only and does not constitute financial advice. Past performance is not indicative of future results. Always do your own research and consult a licensed financial advisor before making investment decisions.
Disclaimer
The information and publications are not meant to be, and do not constitute, financial, investment, trading, or other types of advice or recommendations supplied or endorsed by TradingView. Read more in the Terms of Use.
Disclaimer
The information and publications are not meant to be, and do not constitute, financial, investment, trading, or other types of advice or recommendations supplied or endorsed by TradingView. Read more in the Terms of Use.
