Hyperscale Data, Inc. has reached a critical inflection point, with technical indicators and Fibonacci levels suggesting an imminent 100%+ rally. Here’s why this stock is primed for a major rebound:
1. Strong Fibonacci Support Confirms the Bottom
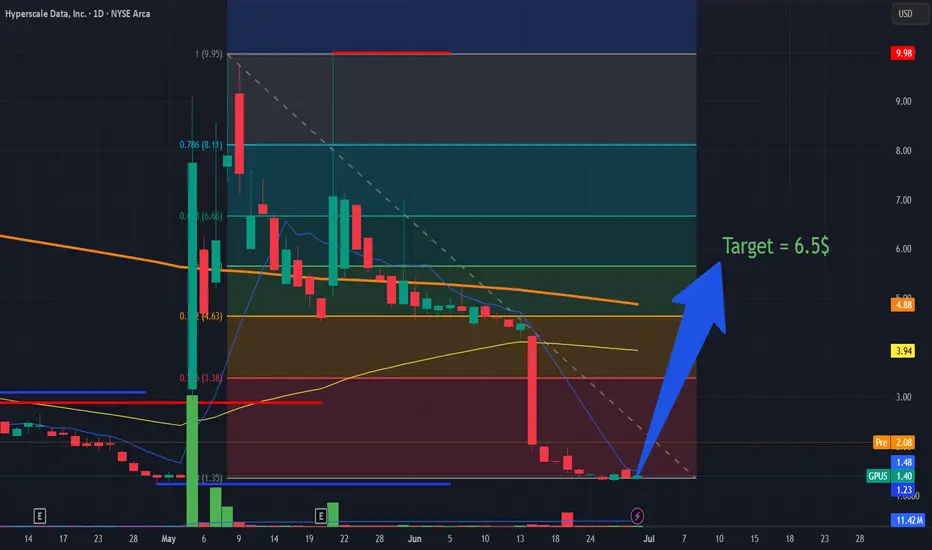
The stock has found a firm floor near $1.33–$1.40, aligning with the 61.8% Fibonacci retracement level—a classic reversal zone where buyers historically step in.
This level also coincides with previous swing lows, reinforcing its significance as a high-probability bounce area.
2. Bullish Divergence Signals Exhausted Selling
While price made lower lows, momentum indicators (RSI, MACD) showed higher lows, indicating weakening downside pressure—a textbook reversal signal.
This divergence often precedes sharp rallies as shorts cover and new buyers enter.
3. Fibonacci Extension Points to $6.55 Target (400%+ Upside)
The $6.55 target aligns with the 161.8% Fibonacci extension level, a common profit-taking zone in strong trends.
Even a partial move toward this level implies a double or triple from current prices.
4. Key Resistance Breakout at $2.23 (38.2% Fib Level)
A decisive breakout above $2.23 (near the 38.2% Fibonacci retracement of the prior downtrend) would confirm trend reversal momentum.
This could trigger a short squeeze and FOMO buying, accelerating gains toward $3.00 (50% Fib) and beyond.
5. Sector Tailwinds (AI & Cloud Computing Demand)
Hyperscale data infrastructure is a high-growth sector, fueled by AI, IoT, and big data expansion.
Any positive earnings surprise or sector news could act as a major catalyst.
Bottom Line
The stock is trading at a deep discount, with Fibonacci levels, accumulation signals, and sector trends all supporting a powerful rebound. Once $2.23 is cleared, the path to $3.00+ opens up quickly.
Watch For:
✅ Break above $2.00 (confirms bullish momentum)
✅ Rising volume on up-days (validates institutional buying)
1. Strong Fibonacci Support Confirms the Bottom
The stock has found a firm floor near $1.33–$1.40, aligning with the 61.8% Fibonacci retracement level—a classic reversal zone where buyers historically step in.
This level also coincides with previous swing lows, reinforcing its significance as a high-probability bounce area.
2. Bullish Divergence Signals Exhausted Selling
While price made lower lows, momentum indicators (RSI, MACD) showed higher lows, indicating weakening downside pressure—a textbook reversal signal.
This divergence often precedes sharp rallies as shorts cover and new buyers enter.
3. Fibonacci Extension Points to $6.55 Target (400%+ Upside)
The $6.55 target aligns with the 161.8% Fibonacci extension level, a common profit-taking zone in strong trends.
Even a partial move toward this level implies a double or triple from current prices.
4. Key Resistance Breakout at $2.23 (38.2% Fib Level)
A decisive breakout above $2.23 (near the 38.2% Fibonacci retracement of the prior downtrend) would confirm trend reversal momentum.
This could trigger a short squeeze and FOMO buying, accelerating gains toward $3.00 (50% Fib) and beyond.
5. Sector Tailwinds (AI & Cloud Computing Demand)
Hyperscale data infrastructure is a high-growth sector, fueled by AI, IoT, and big data expansion.
Any positive earnings surprise or sector news could act as a major catalyst.
Bottom Line
The stock is trading at a deep discount, with Fibonacci levels, accumulation signals, and sector trends all supporting a powerful rebound. Once $2.23 is cleared, the path to $3.00+ opens up quickly.
Watch For:
✅ Break above $2.00 (confirms bullish momentum)
✅ Rising volume on up-days (validates institutional buying)
Disclaimer
The information and publications are not meant to be, and do not constitute, financial, investment, trading, or other types of advice or recommendations supplied or endorsed by TradingView. Read more in the Terms of Use.
Disclaimer
The information and publications are not meant to be, and do not constitute, financial, investment, trading, or other types of advice or recommendations supplied or endorsed by TradingView. Read more in the Terms of Use.