🔍 Analysis Overview
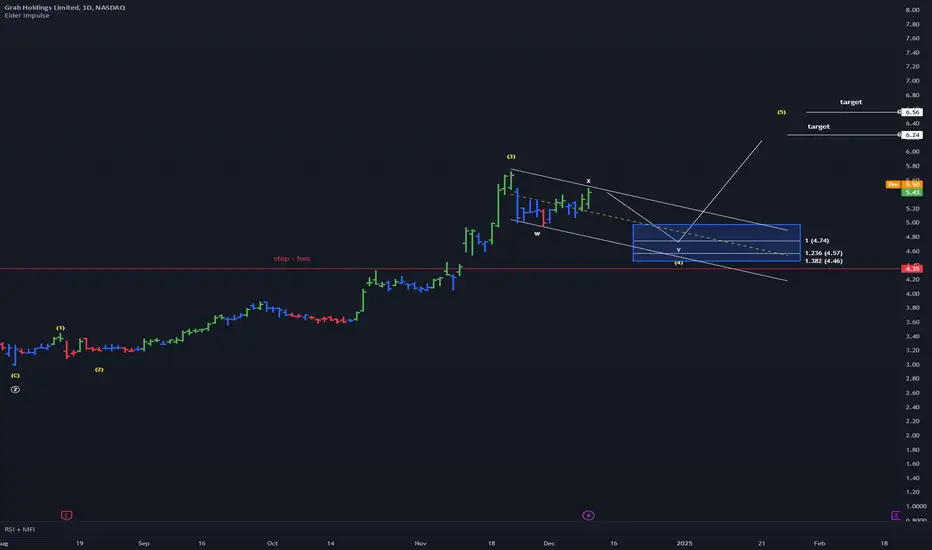
This chart outlines a possible Elliott Wave corrective structure on Grab's daily timeframe. The analysis focuses on the following:
Corrective Wave Pattern:
- Wave W and X appear complete, with wave Y potentially targeting the Fibonacci retracement zone.
Wave Y Target Zone:
- Primary target between 4.57 (1.236) and 4.40 (1.382), supported by the downward channel trendline.
Bullish Targets Post-Correction:
- Immediate target at 6.24, with a secondary target at 6.56, assuming the corrective structure resolves bullishly.
Risk Management:
- Stop-loss positioned at 4.35 to account for a breakdown scenario invalidating the wave count.
📊 Indicators:
- RSI and MFI suggest the possibility of further correction before resuming an upward trend, providing additional confidence in the projected wave Y completion zone.
@ TheStockWhale on Twitter / X
Disclaimer
The information and publications are not meant to be, and do not constitute, financial, investment, trading, or other types of advice or recommendations supplied or endorsed by TradingView. Read more in the Terms of Use.
@ TheStockWhale on Twitter / X
Disclaimer
The information and publications are not meant to be, and do not constitute, financial, investment, trading, or other types of advice or recommendations supplied or endorsed by TradingView. Read more in the Terms of Use.