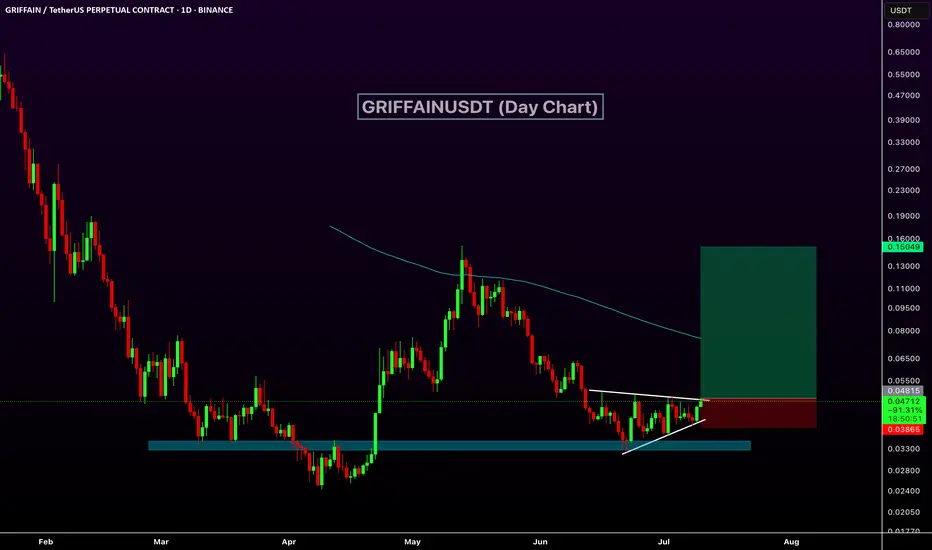
$GRIFFAIN is forming a bullish ascending triangle pattern on the daily chart, signaling a potential breakout. Price is consolidating just below key resistance at $0.048, supported by a strong ascending trendline and a historical support zone.
A breakout above the triangle could trigger a sharp move toward the $0.15 level, offering a potential upside of over 100%-200%. The setup suggests growing bullish momentum and a possible trend reversal.

 GRIFFAINUSDT
A breakout above the triangle could trigger a sharp move toward the $0.15 level, offering a potential upside of over 100%-200%. The setup suggests growing bullish momentum and a possible trend reversal.
🚀Telegram : t.me/hexatrades
🌐Website: hexatrades.io/
🗣️Twitter(X): twitter.com/HexaTrades
🌐Website: hexatrades.io/
🗣️Twitter(X): twitter.com/HexaTrades
Related publications
Disclaimer
The information and publications are not meant to be, and do not constitute, financial, investment, trading, or other types of advice or recommendations supplied or endorsed by TradingView. Read more in the Terms of Use.