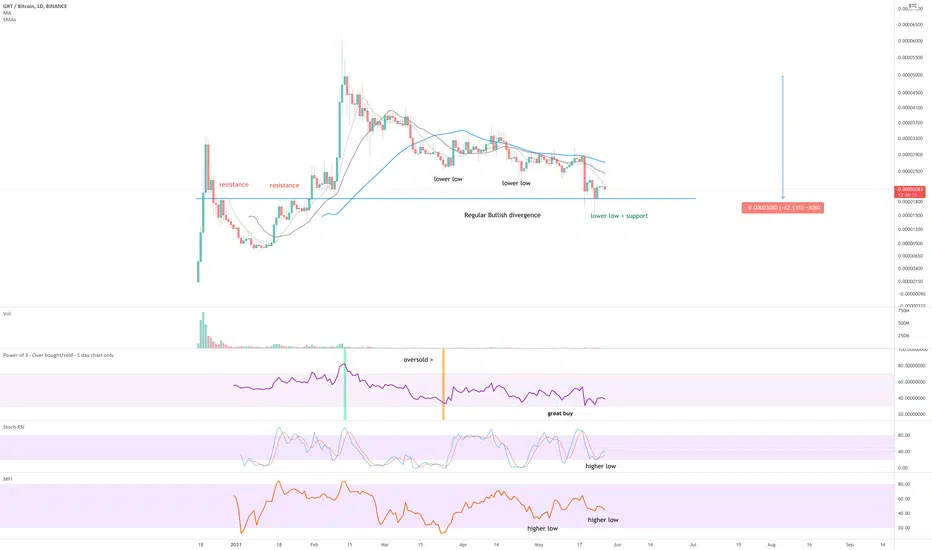
On the above 1-day chart price action has corrected 60% since mid-February resulting in an oversold condition (orange column). Regular bullish divergence is now visible between lower lows in price action and higher highs with Stochastic RSI + Money Flow index (MFI).
Furthermore more price action has landed on past resistance as support, look left. Together with the divergence this is a great signal of a probable upside move with little downside risk.
Is it possible price action continues to fall? Sure.
Is it probable? Unlikely.
1st target 5000 sats. Good luck!
WW
Trade active
Trade active
Bullish divergence with bullish engulfing candles.Trade active
Price action breaks out of resistance BTC
bc1q2eckdzh0q8vsd7swcc8et6ze7s99khhxyl7zwy
Weblink: patreon.com/withoutworries
Allow 3-6 months on ideas. Not investment advice. DYOR
bc1q2eckdzh0q8vsd7swcc8et6ze7s99khhxyl7zwy
Weblink: patreon.com/withoutworries
Allow 3-6 months on ideas. Not investment advice. DYOR
Disclaimer
The information and publications are not meant to be, and do not constitute, financial, investment, trading, or other types of advice or recommendations supplied or endorsed by TradingView. Read more in the Terms of Use.
BTC
bc1q2eckdzh0q8vsd7swcc8et6ze7s99khhxyl7zwy
Weblink: patreon.com/withoutworries
Allow 3-6 months on ideas. Not investment advice. DYOR
bc1q2eckdzh0q8vsd7swcc8et6ze7s99khhxyl7zwy
Weblink: patreon.com/withoutworries
Allow 3-6 months on ideas. Not investment advice. DYOR
Disclaimer
The information and publications are not meant to be, and do not constitute, financial, investment, trading, or other types of advice or recommendations supplied or endorsed by TradingView. Read more in the Terms of Use.