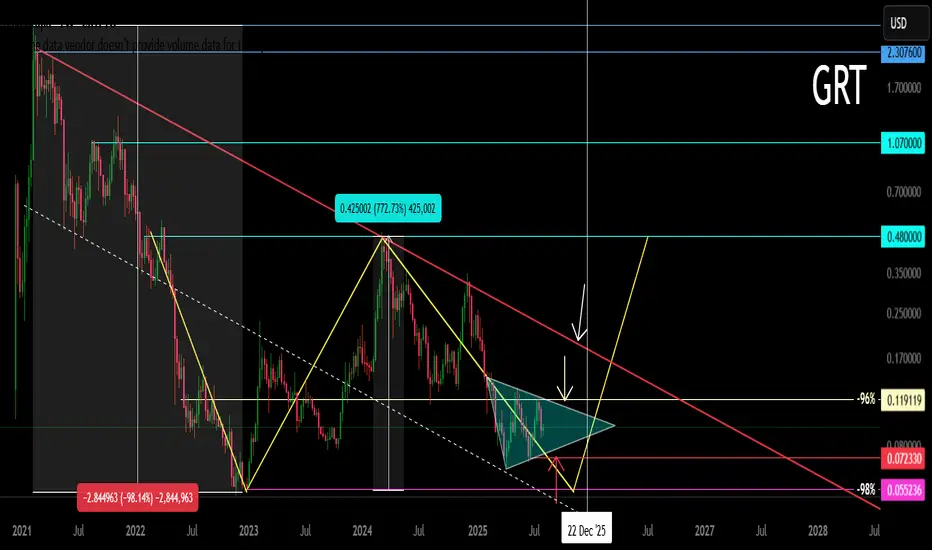
Logarithm. Time frame 1 week.
Main trend. Supplement for clarity to the previous idea for this cryptocurrency, published 23 02 2025 Everything is essentially the same, the new idea is made to visualize the trend, nothing more.
GRT Main trend.
Line chart, price now
Secondary. Big double bottom (in any case, with local scenario A or B, it will be realized in the medium term).
Local trend (price movements in the trend minimum zones before a big pump). Triangle above the Gann fan ray (see the previous idea, where this tool of the logic of movement in the trend is shown).


The second wave of the triangle is formed.
A downward breakout is a descending pennant, which is the removal of longs under the pattern of a larger scale of historical minimums.
A upward breakout is the realization of the triangle targets, and the price movement to the descending line of the main trend +80-100%
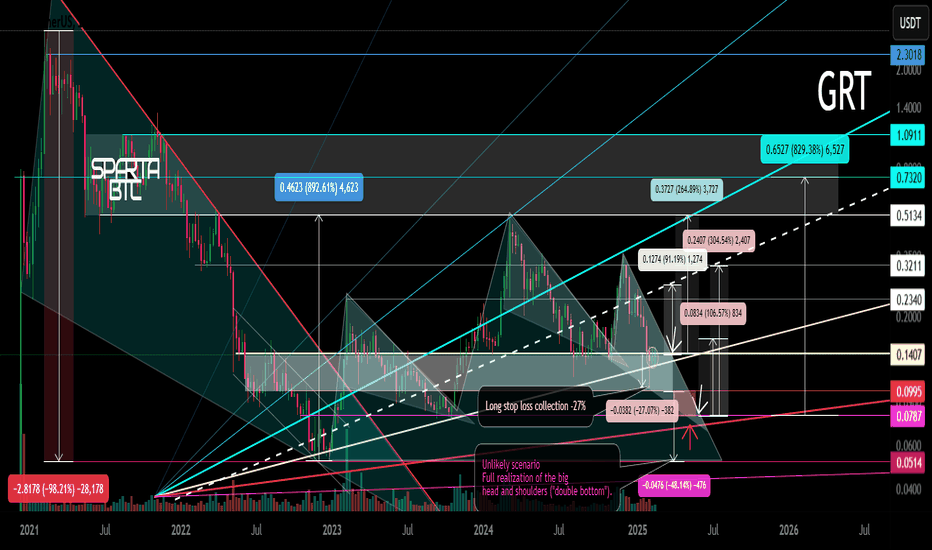
Main trend. Supplement for clarity to the previous idea for this cryptocurrency, published 23 02 2025 Everything is essentially the same, the new idea is made to visualize the trend, nothing more.
GRT Main trend.
Line chart, price now
Secondary. Big double bottom (in any case, with local scenario A or B, it will be realized in the medium term).
Local trend (price movements in the trend minimum zones before a big pump). Triangle above the Gann fan ray (see the previous idea, where this tool of the logic of movement in the trend is shown).
The second wave of the triangle is formed.
A downward breakout is a descending pennant, which is the removal of longs under the pattern of a larger scale of historical minimums.
A upward breakout is the realization of the triangle targets, and the price movement to the descending line of the main trend +80-100%
✅ Telegram. Finance + Trading: t.me/SpartaBTC_1318
✅ Telegram. Сrypto trading only: t.me/SpartaBTC_tradingview
✅ Instagram: instagram.com/spartabtc_1318
✅ YouTube (Rus): goo.su/vpRzRa2
✅ Telegram. Сrypto trading only: t.me/SpartaBTC_tradingview
✅ Instagram: instagram.com/spartabtc_1318
✅ YouTube (Rus): goo.su/vpRzRa2
Related publications
Disclaimer
The information and publications are not meant to be, and do not constitute, financial, investment, trading, or other types of advice or recommendations supplied or endorsed by TradingView. Read more in the Terms of Use.