Hello TradingView Family / Fellow Traders. This is Richard, as known as theSignalyst.
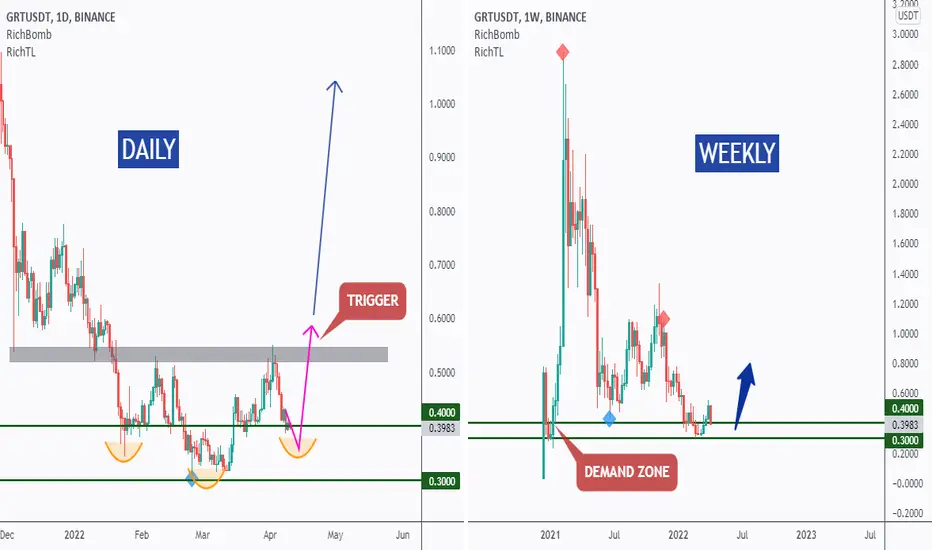
WEEKLY: Right Chart
GRT is overall bearish however, it is approaching a strong demand zone in green so we will be looking for buy setups on lower timeframes.
DAILY: Left Chart
GRT is forming an inverse head and shoulders pattern but it is not ready to go yet.
Trigger => For the bulls to take over, we need a momentum candle close above the gray neckline.
Meanwhile, until the buy is activated, GRT can still trade lower inside the demand zone.
Always follow your trading plan regarding entry, risk management, and trade management.
Good luck!
All Strategies Are Good; If Managed Properly!
~Rich
Trade Made Simple
RichTL.com
Instagram:
instagram.com/richthesignalyst
Telegram
t.me/thesignalyst
Best CFD broker - Tickmill
cutt.ly/TickmillReal
Kucoin Exchange
kucoin.com/r/af/signalyst
RichTL.com
Instagram:
instagram.com/richthesignalyst
Telegram
t.me/thesignalyst
Best CFD broker - Tickmill
cutt.ly/TickmillReal
Kucoin Exchange
kucoin.com/r/af/signalyst
Disclaimer
The information and publications are not meant to be, and do not constitute, financial, investment, trading, or other types of advice or recommendations supplied or endorsed by TradingView. Read more in the Terms of Use.