Goldman Sachs -  GS
GS
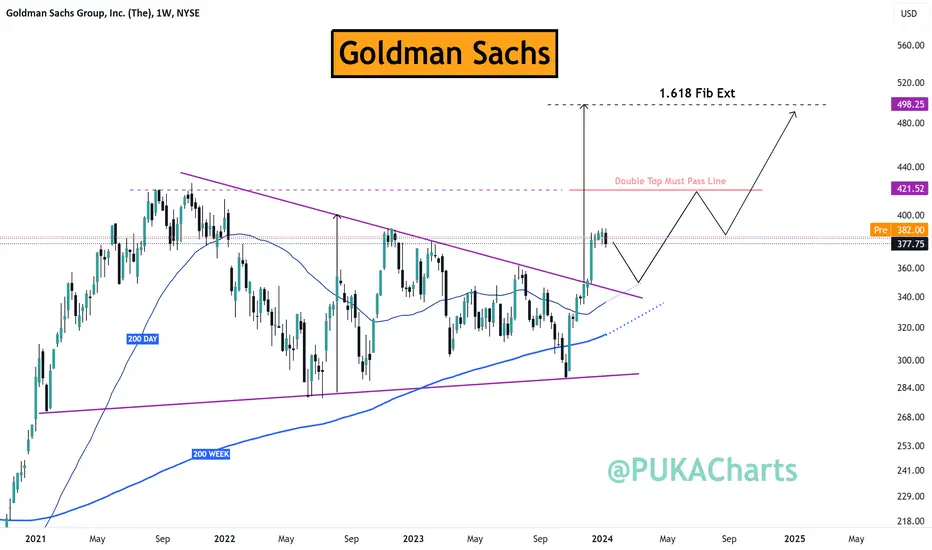
Chart looks promising
✅ Rising 200 week and 200 day
✅Break out of long term pennant
✅ Pull back would be healthy here
🚨 Main concern would be a double top rejection from red line on the chart
Earnings Perspective
Rev ~~ $11.32B, EST. $10.84B
EPS ~~$5.48 VS. $3.32 Y/Y
AUM ~~ $2.81T, EST. $2.77T
PUKA
Chart looks promising
✅ Rising 200 week and 200 day
✅Break out of long term pennant
✅ Pull back would be healthy here
🚨 Main concern would be a double top rejection from red line on the chart
Earnings Perspective
Rev ~~ $11.32B, EST. $10.84B
EPS ~~$5.48 VS. $3.32 Y/Y
AUM ~~ $2.81T, EST. $2.77T
PUKA
Related publications
Disclaimer
The information and publications are not meant to be, and do not constitute, financial, investment, trading, or other types of advice or recommendations supplied or endorsed by TradingView. Read more in the Terms of Use.
Related publications
Disclaimer
The information and publications are not meant to be, and do not constitute, financial, investment, trading, or other types of advice or recommendations supplied or endorsed by TradingView. Read more in the Terms of Use.