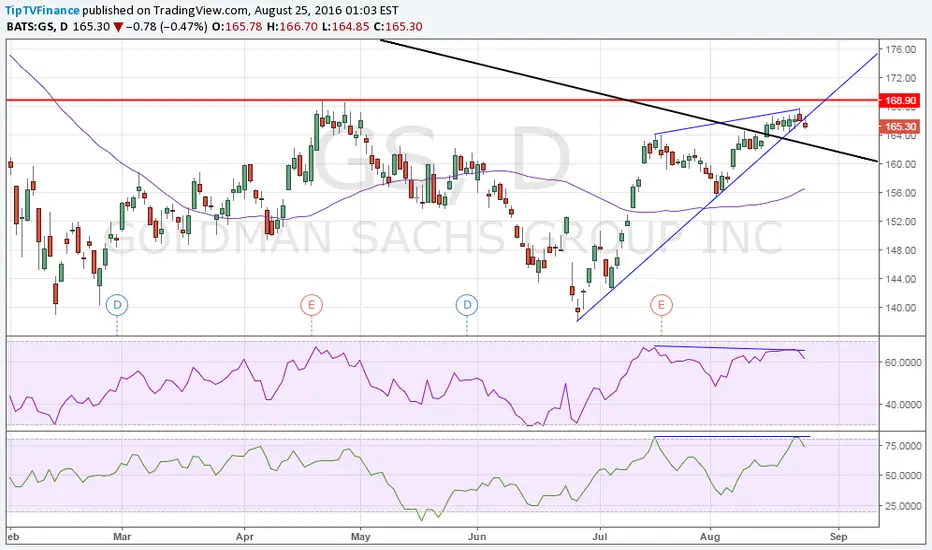
Daily chart shows –
Money flow index turning lower from overbought territory
Prices could test long-term falling trend line support (earlier resistance) now seen at 162.50 levels. A daily close below the same would confirm trend reversal and open doors for a drop to 50-DMA.
On the higher side, only a day end close above 168.90 (Apr 21 high) would signal continuation of the rally from June 27 low.
- Breach of rising trend line
- Bearish price RSI divergence
Money flow index turning lower from overbought territory
Prices could test long-term falling trend line support (earlier resistance) now seen at 162.50 levels. A daily close below the same would confirm trend reversal and open doors for a drop to 50-DMA.
On the higher side, only a day end close above 168.90 (Apr 21 high) would signal continuation of the rally from June 27 low.
Related publications
Disclaimer
The information and publications are not meant to be, and do not constitute, financial, investment, trading, or other types of advice or recommendations supplied or endorsed by TradingView. Read more in the Terms of Use.
Related publications
Disclaimer
The information and publications are not meant to be, and do not constitute, financial, investment, trading, or other types of advice or recommendations supplied or endorsed by TradingView. Read more in the Terms of Use.