Analysis:
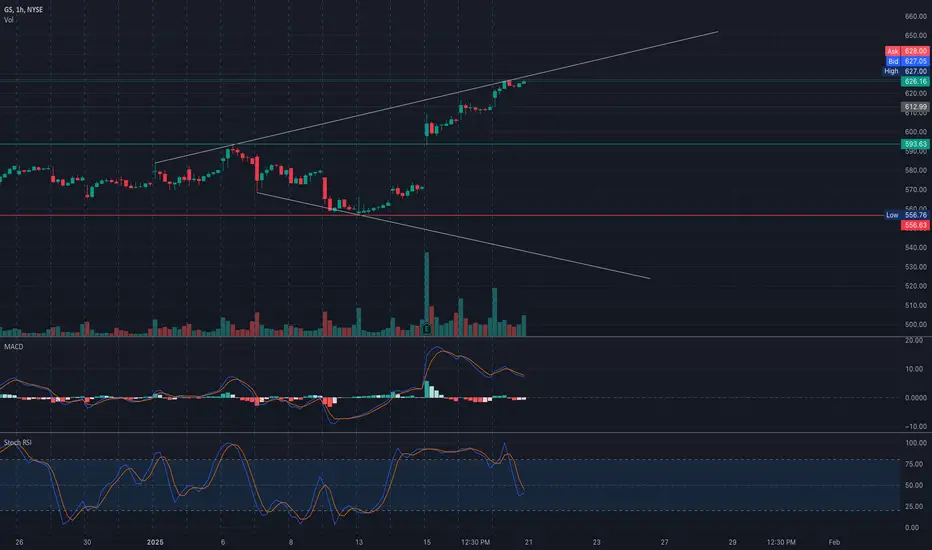
Goldman Sachs (GS) is approaching the upper boundary of its rising channel near $628, suggesting a potential for either a breakout or a rejection. The stock has shown strong upward momentum, rallying from the $556 support level. The MACD remains bullish, although the histogram is flattening, indicating slowing momentum. Meanwhile, the Stochastic RSI is nearing overbought levels, hinting at a possible pullback or consolidation.
Volume remains consistent, supporting the uptrend, but traders should watch closely as the stock approaches a critical resistance zone.
Key Levels to Watch:
* Resistance Levels:
* $628: Immediate resistance at the current price level, aligning with the upper channel boundary.
* $630-$635: Extended resistance zone if momentum continues.
* Support Levels:
* $620: Near-term support level within the rising channel.
* $600: Key psychological and technical support.
* $556-$560: Strong downside support, aligning with previous lows.
GEX Insights:

* Gamma Exposure (GEX):
* Positive GEX peaks at $630, signaling strong resistance.
* Support zones are solid at $600 due to substantial negative GEX positioning.
* Options Activity:
* IVR: Moderate, reflecting steady implied volatility.
* Call/Put Ratio: Leaning bullish, but resistance overhead may limit gains.
Trade Scenarios:
Bullish Scenario:
* Entry: Break above $628 with increasing volume.
* Target: $635 (first target), $640 (extended target).
* Stop-Loss: Below $620.
Bearish Scenario:
* Entry: Rejection near $628 with bearish price action.
* Target: $620 (first target), $600 (extended target).
* Stop-Loss: Above $630.
Directional Bias:
The bias is cautiously bullish as GS continues to trend higher within its rising channel. However, the $628-$630 zone poses significant resistance, and a failure to break above this level may result in a pullback toward $620 or lower.
Disclaimer: This analysis is for educational purposes only and does not constitute financial advice. Always do your own research and manage your risk before trading.
Goldman Sachs (GS) is approaching the upper boundary of its rising channel near $628, suggesting a potential for either a breakout or a rejection. The stock has shown strong upward momentum, rallying from the $556 support level. The MACD remains bullish, although the histogram is flattening, indicating slowing momentum. Meanwhile, the Stochastic RSI is nearing overbought levels, hinting at a possible pullback or consolidation.
Volume remains consistent, supporting the uptrend, but traders should watch closely as the stock approaches a critical resistance zone.
Key Levels to Watch:
* Resistance Levels:
* $628: Immediate resistance at the current price level, aligning with the upper channel boundary.
* $630-$635: Extended resistance zone if momentum continues.
* Support Levels:
* $620: Near-term support level within the rising channel.
* $600: Key psychological and technical support.
* $556-$560: Strong downside support, aligning with previous lows.
GEX Insights:
* Gamma Exposure (GEX):
* Positive GEX peaks at $630, signaling strong resistance.
* Support zones are solid at $600 due to substantial negative GEX positioning.
* Options Activity:
* IVR: Moderate, reflecting steady implied volatility.
* Call/Put Ratio: Leaning bullish, but resistance overhead may limit gains.
Trade Scenarios:
Bullish Scenario:
* Entry: Break above $628 with increasing volume.
* Target: $635 (first target), $640 (extended target).
* Stop-Loss: Below $620.
Bearish Scenario:
* Entry: Rejection near $628 with bearish price action.
* Target: $620 (first target), $600 (extended target).
* Stop-Loss: Above $630.
Directional Bias:
The bias is cautiously bullish as GS continues to trend higher within its rising channel. However, the $628-$630 zone poses significant resistance, and a failure to break above this level may result in a pullback toward $620 or lower.
Disclaimer: This analysis is for educational purposes only and does not constitute financial advice. Always do your own research and manage your risk before trading.
Disclaimer
The information and publications are not meant to be, and do not constitute, financial, investment, trading, or other types of advice or recommendations supplied or endorsed by TradingView. Read more in the Terms of Use.
Disclaimer
The information and publications are not meant to be, and do not constitute, financial, investment, trading, or other types of advice or recommendations supplied or endorsed by TradingView. Read more in the Terms of Use.