Hi Traders
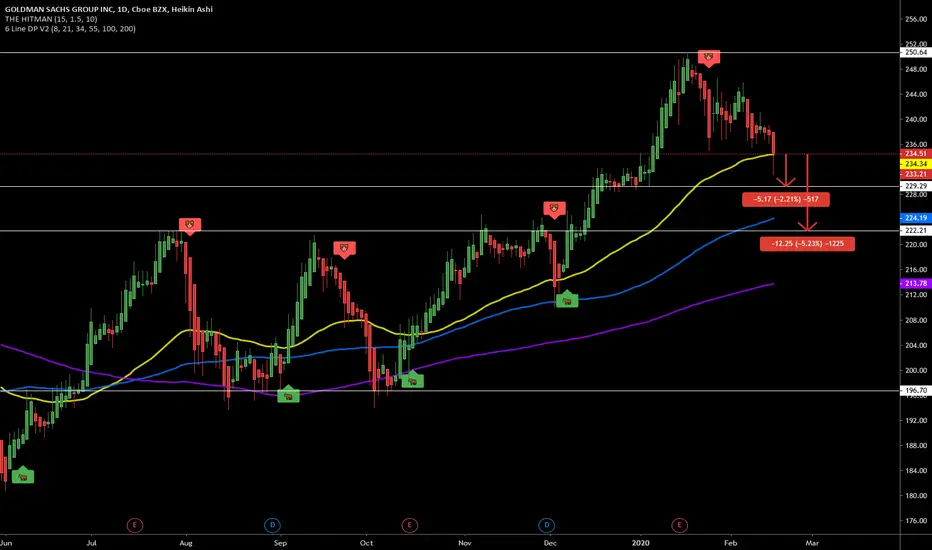
Looking at the daily chart of Goldman Sachs it shows you a possible short time down trend. As Moving Averages still form an upward trend, this analysis
is meant for a shorter time only. Over a longer timeframe it still looks like a long.
Looking at the daily chart of Goldman Sachs it shows you a possible short time down trend. As Moving Averages still form an upward trend, this analysis
is meant for a shorter time only. Over a longer timeframe it still looks like a long.
Disclaimer
The information and publications are not meant to be, and do not constitute, financial, investment, trading, or other types of advice or recommendations supplied or endorsed by TradingView. Read more in the Terms of Use.
Disclaimer
The information and publications are not meant to be, and do not constitute, financial, investment, trading, or other types of advice or recommendations supplied or endorsed by TradingView. Read more in the Terms of Use.