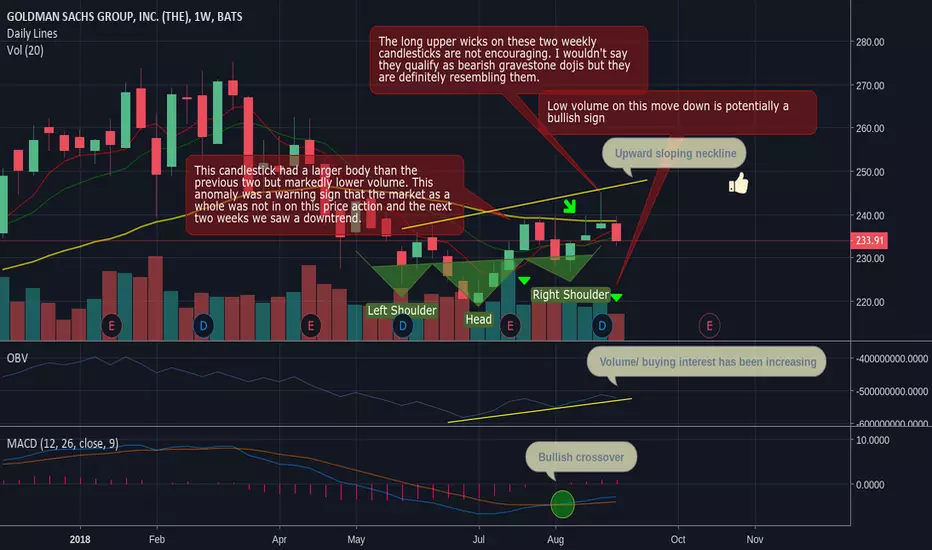
This will be a short post because there is a lot of verbiage in the chart. Generally while I definitely see a few bearish signs in Goldmans chart most are relatively bullish. Keep in mind these are weekly candlesticks used to project what may happen in several weeks or potentially months time so don't infer anything about day to day movements from this analysis. Questions and criticisms welcome, thanks.
Note
If one looks at the daily charts for August you will notice a very interesting pattern with respect to this analysis, there is another inverse head and shoulders, shorter in duration, that spans one month.Disclaimer
The information and publications are not meant to be, and do not constitute, financial, investment, trading, or other types of advice or recommendations supplied or endorsed by TradingView. Read more in the Terms of Use.
Disclaimer
The information and publications are not meant to be, and do not constitute, financial, investment, trading, or other types of advice or recommendations supplied or endorsed by TradingView. Read more in the Terms of Use.