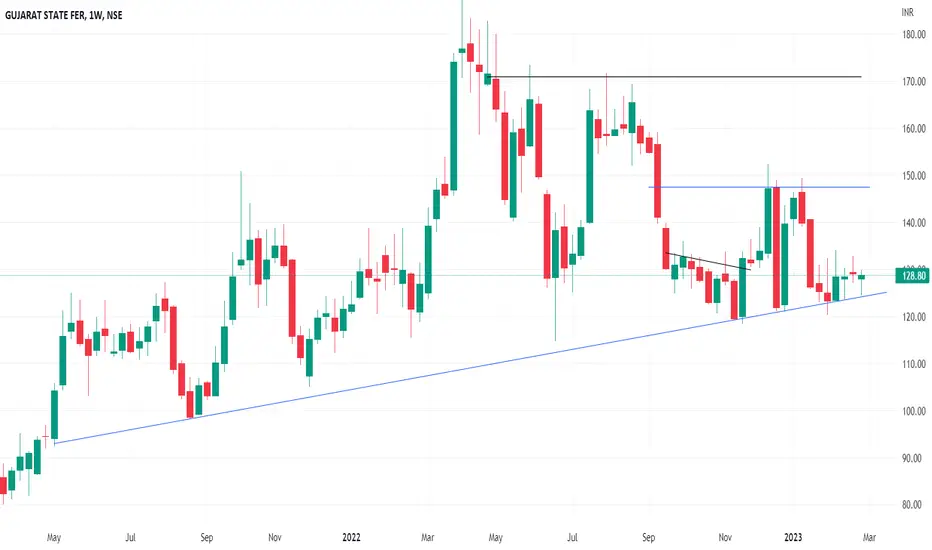
In the Weekly Chart of GSFC ,
we can see that, after consolidation at support Trendline, it has formed a Bullish Hammer.
Enter at 130 with 124 as SL.
Go Long till 170 and exit.
we can see that, after consolidation at support Trendline, it has formed a Bullish Hammer.
Enter at 130 with 124 as SL.
Go Long till 170 and exit.
Disclaimer
The information and publications are not meant to be, and do not constitute, financial, investment, trading, or other types of advice or recommendations supplied or endorsed by TradingView. Read more in the Terms of Use.
Disclaimer
The information and publications are not meant to be, and do not constitute, financial, investment, trading, or other types of advice or recommendations supplied or endorsed by TradingView. Read more in the Terms of Use.