GSL (Global Ship Lease, Inc.) - Undervalued Container Shipping Play with Strong Technicals
Symbol: GSL (NYSE) | Sector: Marine Shipping | Market Cap: $1.1B
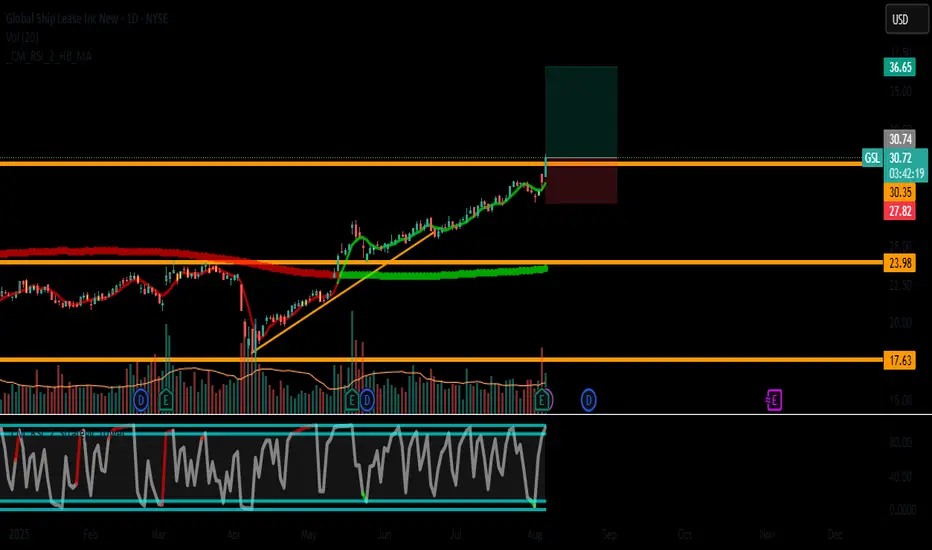
🚢 Trade Setup (Daily Chart)
Entry: $30.76
Near cluster support (50-day EMA + horizontal $30.50 level)
Confirm with bullish candle/volume surge
Stop Loss: $27.80 (-9.6%)
Below 200-day SMA and July swing low
Take Profit: $36.65 (+19.1%)
$34.20 (2023 high) → Take 50% profit
$36.65 (1:2 R/R) → Full exit
📊 Fundamental Edge
Dirt Cheap Valuation:
P/E: 2.8 (vs industry avg 8.5)
P/B: 0.7 (assets worth 2x market cap)
EV/EBITDA: 3.1 (sector avg 6.8)
Strong Financials:
97% fleet utilization (2024)
$250M+ annual FCF
6% dividend yield (sustainable)
Industry Tailwinds:
Red Sea disruptions → higher charter rates
Global container demand growth
📈 Technical Confirmation
✅ Trend: Higher highs/lows since Jan 2024
✅ Momentum:
RSI(14): 58 (neutral)
MACD histogram turning positive
✅ Volume: Accumulation pattern last 3 weeks
⚓️ Trade Management
Size: 2-3% portfolio risk
Trail Stop: Move to $31.50 after hitting $34
Watch: Baltic Dry Index (BDI) for sector momentum
⚠️ Key Risks
Global trade slowdown
Charter rate volatility
Fuel price spikes
Chart: [Insert TradingView Link]
#GSL #ShippingStocks #ValueInvesting #Dividend
📌 Disclaimer: Not financial advice. Shipping stocks are volatile. Do your own research. Past performance ≠ future results.
💬 Discussion:
How are you playing the shipping sector?
Like if you'd take this trade!
Symbol: GSL (NYSE) | Sector: Marine Shipping | Market Cap: $1.1B
🚢 Trade Setup (Daily Chart)
Entry: $30.76
Near cluster support (50-day EMA + horizontal $30.50 level)
Confirm with bullish candle/volume surge
Stop Loss: $27.80 (-9.6%)
Below 200-day SMA and July swing low
Take Profit: $36.65 (+19.1%)
$34.20 (2023 high) → Take 50% profit
$36.65 (1:2 R/R) → Full exit
📊 Fundamental Edge
Dirt Cheap Valuation:
P/E: 2.8 (vs industry avg 8.5)
P/B: 0.7 (assets worth 2x market cap)
EV/EBITDA: 3.1 (sector avg 6.8)
Strong Financials:
97% fleet utilization (2024)
$250M+ annual FCF
6% dividend yield (sustainable)
Industry Tailwinds:
Red Sea disruptions → higher charter rates
Global container demand growth
📈 Technical Confirmation
✅ Trend: Higher highs/lows since Jan 2024
✅ Momentum:
RSI(14): 58 (neutral)
MACD histogram turning positive
✅ Volume: Accumulation pattern last 3 weeks
⚓️ Trade Management
Size: 2-3% portfolio risk
Trail Stop: Move to $31.50 after hitting $34
Watch: Baltic Dry Index (BDI) for sector momentum
⚠️ Key Risks
Global trade slowdown
Charter rate volatility
Fuel price spikes
Chart: [Insert TradingView Link]
#GSL #ShippingStocks #ValueInvesting #Dividend
📌 Disclaimer: Not financial advice. Shipping stocks are volatile. Do your own research. Past performance ≠ future results.
💬 Discussion:
How are you playing the shipping sector?
Like if you'd take this trade!
Disclaimer
The information and publications are not meant to be, and do not constitute, financial, investment, trading, or other types of advice or recommendations supplied or endorsed by TradingView. Read more in the Terms of Use.
Disclaimer
The information and publications are not meant to be, and do not constitute, financial, investment, trading, or other types of advice or recommendations supplied or endorsed by TradingView. Read more in the Terms of Use.