Updated
GTO/USDT Secondary trend. Triangle 666%
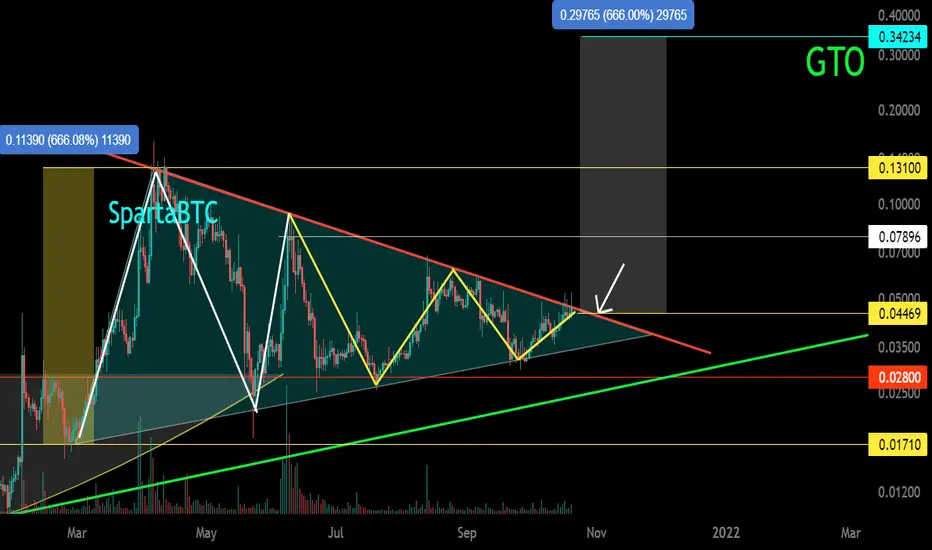
A huge symmetrical triangle with a base of 666% was formed above the resistance of the large cup. Just so you understand in such triangles there is a partial reset of the position (waves, traders' interest). The price is driven into the corner of the formation and is under its resistance. The final part of the triangle is a double-bottom pattern with an ascending minimum with a base of 108%.
Coin Market Coin: GTO
Notice how the people who drive the price of this cryptocurrency are tied to numerical meanings. Pay attention to the numerical values of levels and pump percentages. You probably understand that this is not a random behavior of bulls/bears and other mythical animals in the market, which is displayed on the price chart as a consequence.
This is what the main trend of this pumptocurrency looks like.

Line Chart. For a clearer understanding of the trend.

My non-public trading idea for this trading pair posted on 11/23 2020 (666/11/22) when price was in the set zone before the trend reversed.
GTO/USD Main trend. Dragon
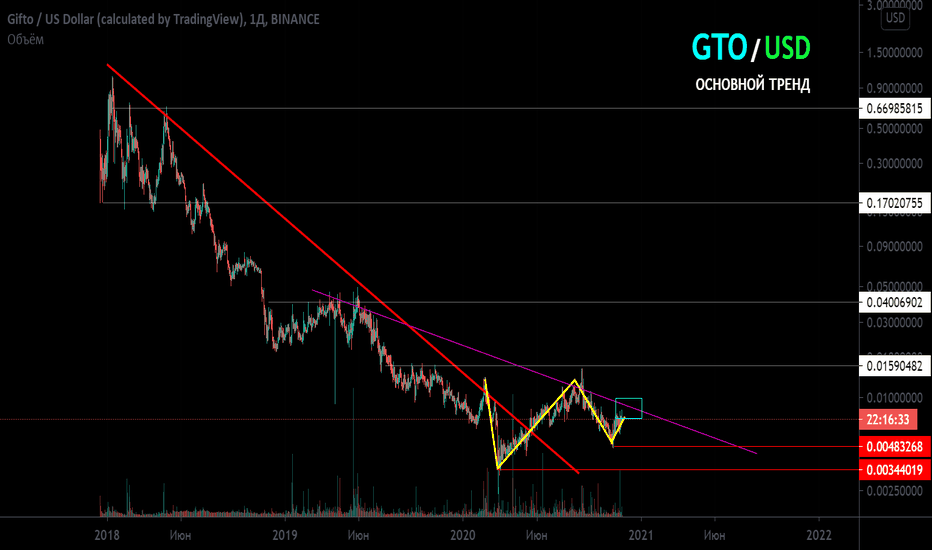
Into the specified zone of resistance level from the reversal +2150%.

Coin Market Coin: GTO
Notice how the people who drive the price of this cryptocurrency are tied to numerical meanings. Pay attention to the numerical values of levels and pump percentages. You probably understand that this is not a random behavior of bulls/bears and other mythical animals in the market, which is displayed on the price chart as a consequence.
This is what the main trend of this pumptocurrency looks like.
Line Chart. For a clearer understanding of the trend.
My non-public trading idea for this trading pair posted on 11/23 2020 (666/11/22) when price was in the set zone before the trend reversed.
GTO/USD Main trend. Dragon
Into the specified zone of resistance level from the reversal +2150%.
Note
Note
✅ Telegram. Finance + Trading: t.me/SpartaBTC_1318
✅ Telegram. Сrypto trading only: t.me/SpartaBTC_tradingview
✅ Instagram: instagram.com/spartabtc_1318
✅ YouTube (Rus): goo.su/vpRzRa2
✅ Telegram. Сrypto trading only: t.me/SpartaBTC_tradingview
✅ Instagram: instagram.com/spartabtc_1318
✅ YouTube (Rus): goo.su/vpRzRa2
Related publications
Disclaimer
The information and publications are not meant to be, and do not constitute, financial, investment, trading, or other types of advice or recommendations supplied or endorsed by TradingView. Read more in the Terms of Use.