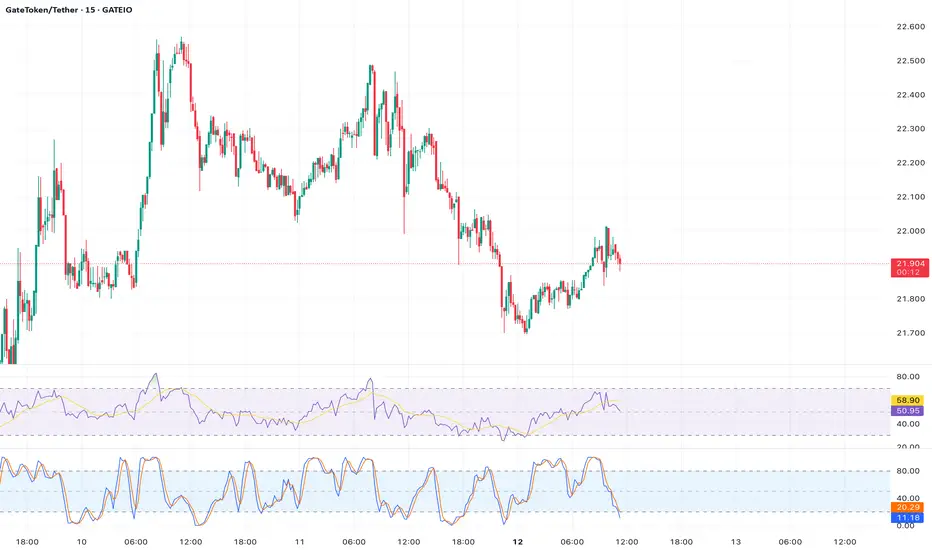
Analysis:  GT’s recent rally to $22.488 was met with rejection at the $22.67 resistance, accompanied by a 34.7% drop in 24-hour trading volume to $11.58M, signaling waning buyer interest. The Williams %R indicator is near -20, indicating overbought conditions. The price is hovering near the upper Bollinger Band, often a precursor to a pullback. A break below $21.47 could trigger a move toward $19.95, with $18.74 as the next support if selling pressure increases.
Entry Point: $21.70
Target Price: $19.95
Stop Loss: $22.90
Timeframe: 1–2 weeks
Rationale: Reduced volume and overbought signals suggestGT is vulnerable to a correction, particularly after failing to break key resistance.
Entry Point: $21.70
Target Price: $19.95
Stop Loss: $22.90
Timeframe: 1–2 weeks
Rationale: Reduced volume and overbought signals suggest
Disclaimer
The information and publications are not meant to be, and do not constitute, financial, investment, trading, or other types of advice or recommendations supplied or endorsed by TradingView. Read more in the Terms of Use.
Disclaimer
The information and publications are not meant to be, and do not constitute, financial, investment, trading, or other types of advice or recommendations supplied or endorsed by TradingView. Read more in the Terms of Use.