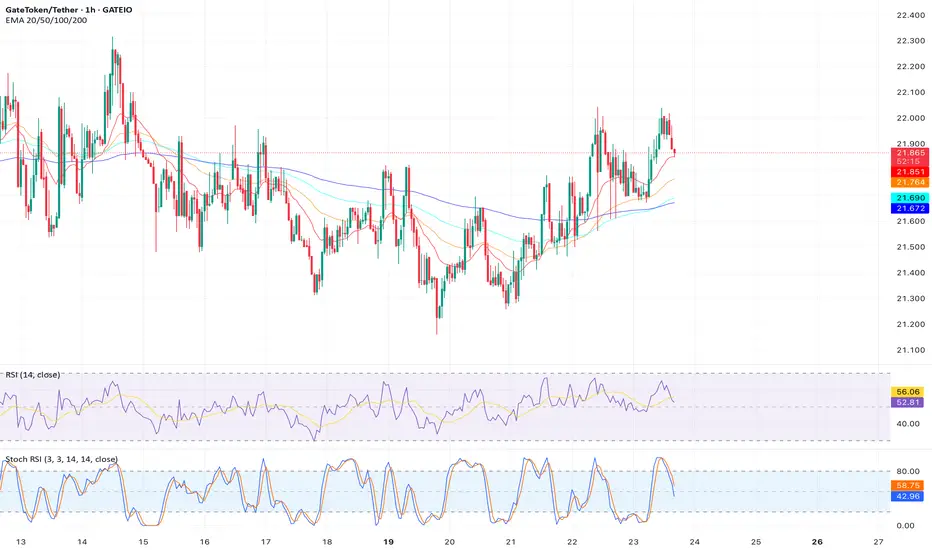
Analysis:  GT is testing a major support at $21.00, forming an inverse head-and-shoulders pattern on the daily chart, with the neckline at $22.50. A breakout above this level could confirm a trend reversal from the recent downtrend. The MACD is showing a bullish crossover (signal line above MACD line), and the stock’s 0.92 beta suggests moderate volatility, supporting a swing trade setup. Analysts’ price targets range from $17.00 to $11.00, but technicals suggest upside to $25.00 if the pattern completes.
Trade Plan:
Entry: $22.60 (breakout above neckline).
Stop Loss: $20.80 (below right shoulder).
Target: $25.00 (pattern target, ~14.2% upside).
Risk-Reward Ratio: 1:2.5.
Timeframe: 2-3 weeks.
Indicators: MACD, Volume, Pattern Analysis.
Trade Plan:
Entry: $22.60 (breakout above neckline).
Stop Loss: $20.80 (below right shoulder).
Target: $25.00 (pattern target, ~14.2% upside).
Risk-Reward Ratio: 1:2.5.
Timeframe: 2-3 weeks.
Indicators: MACD, Volume, Pattern Analysis.
Disclaimer
The information and publications are not meant to be, and do not constitute, financial, investment, trading, or other types of advice or recommendations supplied or endorsed by TradingView. Read more in the Terms of Use.
Disclaimer
The information and publications are not meant to be, and do not constitute, financial, investment, trading, or other types of advice or recommendations supplied or endorsed by TradingView. Read more in the Terms of Use.