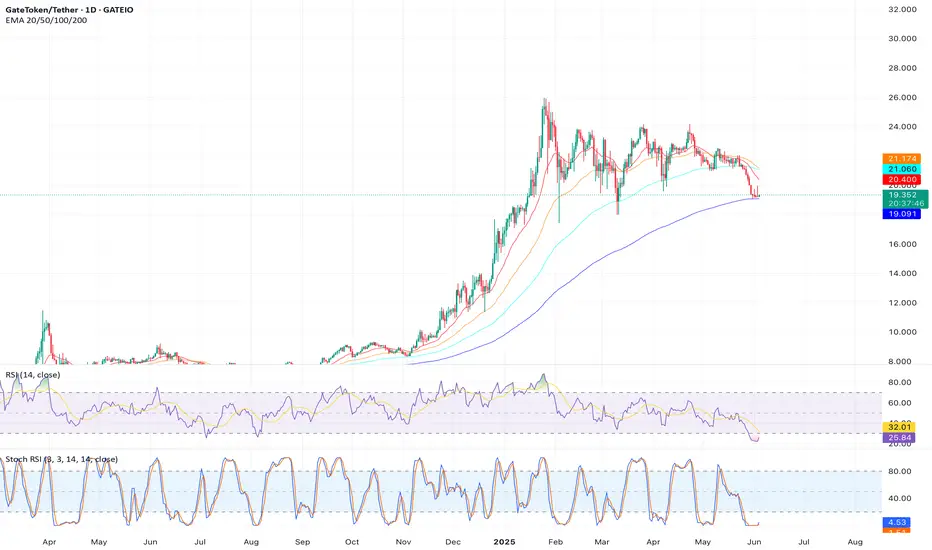
Analysis: Trading at $19.37, GT is showing exhaustion after failing to hold above $21.15. The 4-hour chart displays a sell signal, with the price testing the pivot point at $19.24. The MACD is crossing bearish, and the Bollinger Bands show GT trading below the SMA ($22.59). A breakdown could see prices drop to $18.99.
Outlook: Short below $19.24, targeting $18.99, with a stop-loss above $19.48.
Outlook: Short below $19.24, targeting $18.99, with a stop-loss above $19.48.
Disclaimer
The information and publications are not meant to be, and do not constitute, financial, investment, trading, or other types of advice or recommendations supplied or endorsed by TradingView. Read more in the Terms of Use.
Disclaimer
The information and publications are not meant to be, and do not constitute, financial, investment, trading, or other types of advice or recommendations supplied or endorsed by TradingView. Read more in the Terms of Use.