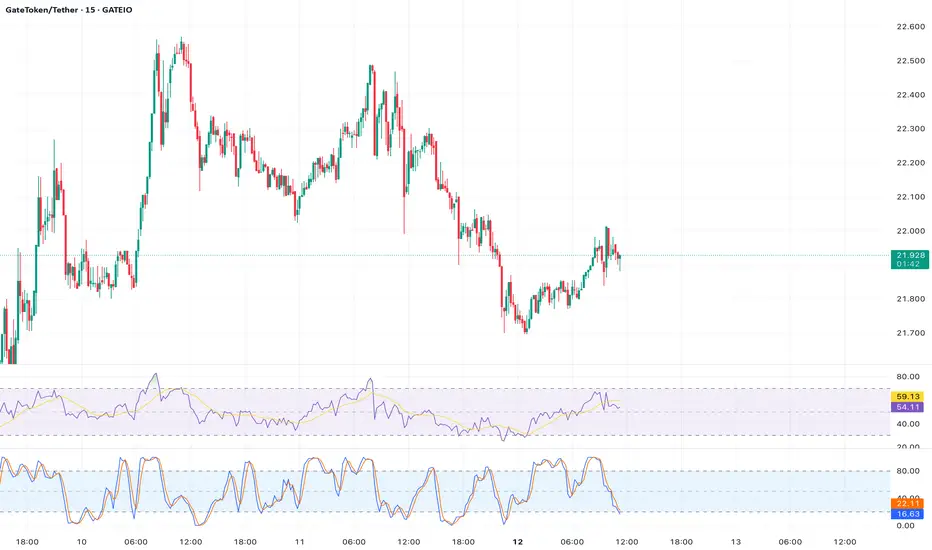
Analysis:  GT recently broke above the $21.15 resistance level, a significant barrier identified in recent price action, with strong volume supporting the move. The 14-day Relative Strength Index (RSI) is at 49.36, indicating neutral momentum with room for upward movement before reaching overbought territory (>70). The 50-day Simple Moving Average (SMA) at $20.97 is trending upward, crossing above the 200-day SMA ($13.09), forming a bullish Golden Cross, which often precedes sustained uptrends. The next resistance is at $22.67, with a potential target of $24.19 if momentum continues. Support holds at $19.95, providing a solid base for a long entry.
Entry Point: $21.80
Target Price: $24.19
Stop Loss: $19.80
Timeframe: 2–4 weeks
Rationale: The breakout, combined with bullish moving average alignment and neutral RSI, suggestsGT could rally toward recent cycle highs, supported by increasing trading volume and positive sentiment in the Gate.io ecosystem.
Entry Point: $21.80
Target Price: $24.19
Stop Loss: $19.80
Timeframe: 2–4 weeks
Rationale: The breakout, combined with bullish moving average alignment and neutral RSI, suggests
Disclaimer
The information and publications are not meant to be, and do not constitute, financial, investment, trading, or other types of advice or recommendations supplied or endorsed by TradingView. Read more in the Terms of Use.
Disclaimer
The information and publications are not meant to be, and do not constitute, financial, investment, trading, or other types of advice or recommendations supplied or endorsed by TradingView. Read more in the Terms of Use.