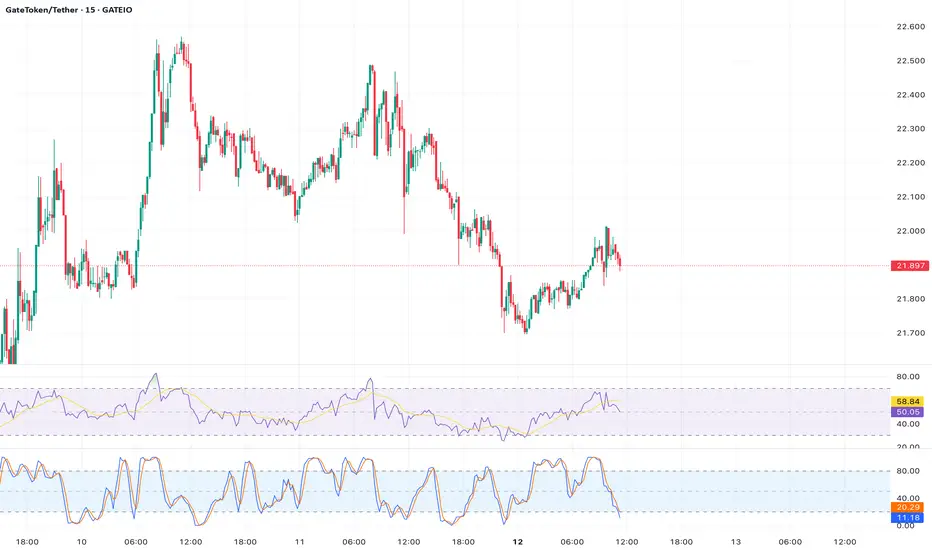
Analysis: A bearish engulfing candlestick pattern formed on the daily chart at $22.559, indicating a potential reversal after a 3.3% intraday gain. The price is trading below the 10-day SMA ($22.10), reinforcing bearish momentum. The Commodity Channel Index (CCI) is trending toward -100, signaling increasing selling pressure. If  GT breaks below $21.47, it could target $19.95, with further downside to $18.74 in a broader correction.
Entry Point: $21.60
Target Price: $19.95
Stop Loss: $22.70
Timeframe: 1–2 weeks
Rationale: The bearish engulfing pattern, combined with declining short-term moving averages and CCI, points to a likely pullback in the near term.
Entry Point: $21.60
Target Price: $19.95
Stop Loss: $22.70
Timeframe: 1–2 weeks
Rationale: The bearish engulfing pattern, combined with declining short-term moving averages and CCI, points to a likely pullback in the near term.
Disclaimer
The information and publications are not meant to be, and do not constitute, financial, investment, trading, or other types of advice or recommendations supplied or endorsed by TradingView. Read more in the Terms of Use.
Disclaimer
The information and publications are not meant to be, and do not constitute, financial, investment, trading, or other types of advice or recommendations supplied or endorsed by TradingView. Read more in the Terms of Use.