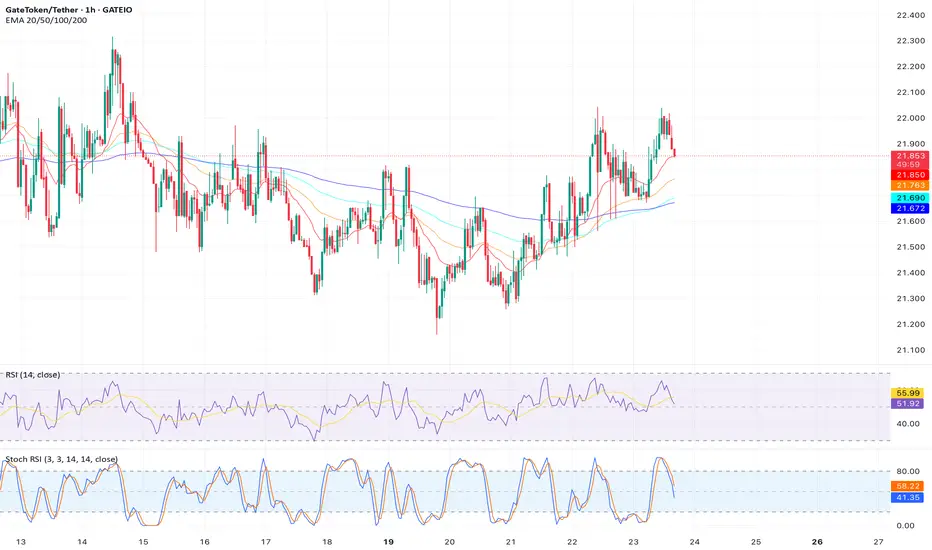
Analysis:  GT is trading in an ascending channel with resistance at $22.50 and support at $20.80. A recent failure to break $22.50, coupled with a bearish RSI divergence (price higher, RSI lower), suggests a potential channel breakdown. The stock’s 0.92 beta indicates it may follow broader market weakness. A break below $21.50 could target $19.00.
Trade Plan:
Entry: $21.40 (break below channel support).
Stop Loss: $22.00 (above channel resistance).
Target: $19.00 (next support, ~12.8% downside).
Risk-Reward Ratio: 1:2.3.
Timeframe: 1-2 weeks.
Indicators: RSI, Channel Pattern, Volume.
Trade Plan:
Entry: $21.40 (break below channel support).
Stop Loss: $22.00 (above channel resistance).
Target: $19.00 (next support, ~12.8% downside).
Risk-Reward Ratio: 1:2.3.
Timeframe: 1-2 weeks.
Indicators: RSI, Channel Pattern, Volume.
Disclaimer
The information and publications are not meant to be, and do not constitute, financial, investment, trading, or other types of advice or recommendations supplied or endorsed by TradingView. Read more in the Terms of Use.
Disclaimer
The information and publications are not meant to be, and do not constitute, financial, investment, trading, or other types of advice or recommendations supplied or endorsed by TradingView. Read more in the Terms of Use.