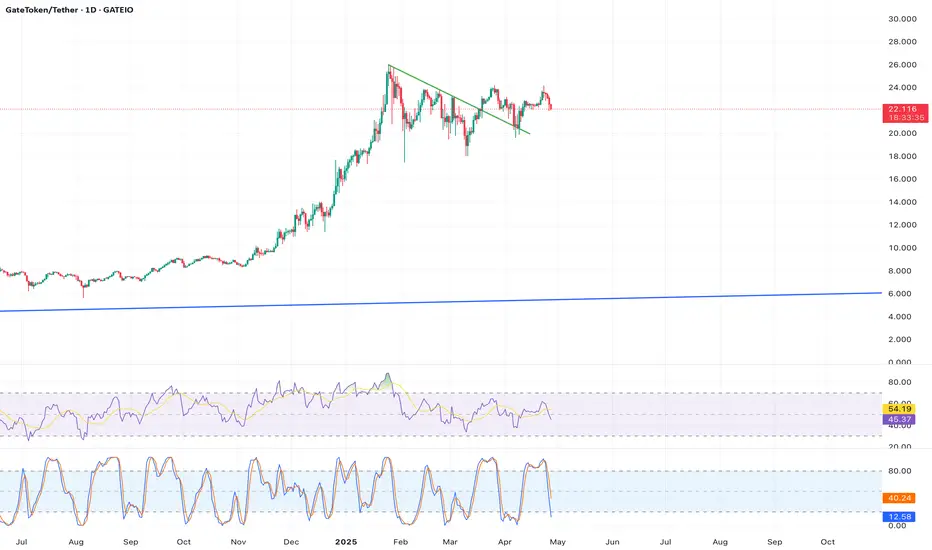
Description: On the 4-hour chart,  GT shows a bearish divergence, with the price making higher highs near $22.145 while the RSI forms lower highs, currently at 65. This suggests weakening momentum. The price is approaching the upper Bollinger Band at $24.42, which may act as resistance. A failure to break $22.71 (next resistance) could lead to a pullback.
Key Indicators/Patterns: Bearish RSI divergence, Bollinger Bands, resistance at $22.71.
Price Target: A pullback could takeGT to $21.15-$21.66 within 3-5 days.
Timeframe: 3-5 days.
Source Reference: (RSI, Bollinger Bands, resistance levels).
Key Indicators/Patterns: Bearish RSI divergence, Bollinger Bands, resistance at $22.71.
Price Target: A pullback could take
Timeframe: 3-5 days.
Source Reference: (RSI, Bollinger Bands, resistance levels).
Disclaimer
The information and publications are not meant to be, and do not constitute, financial, investment, trading, or other types of advice or recommendations supplied or endorsed by TradingView. Read more in the Terms of Use.
Disclaimer
The information and publications are not meant to be, and do not constitute, financial, investment, trading, or other types of advice or recommendations supplied or endorsed by TradingView. Read more in the Terms of Use.