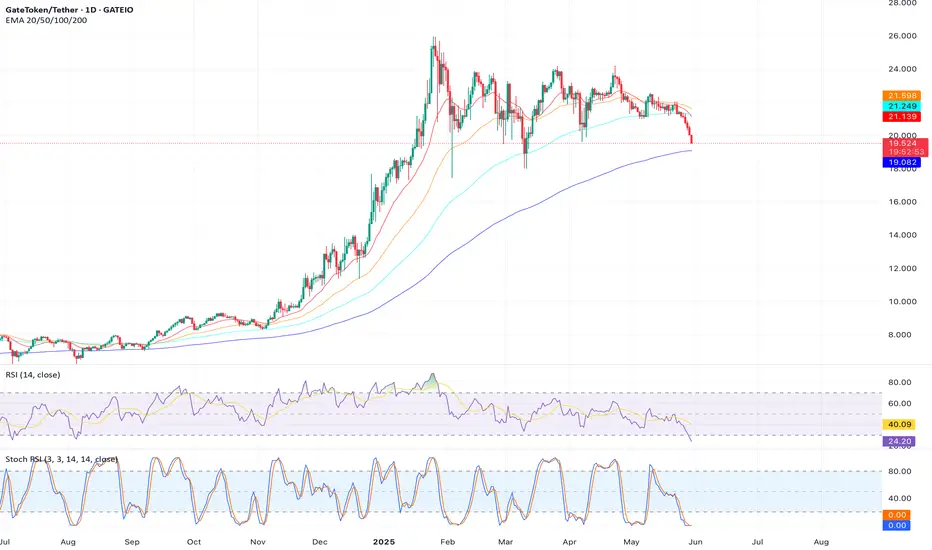
Analysis: GT ($19.50) is testing resistance at $21.66, where a bearish shooting star candle formed on the daily chart, indicating seller dominance. The RSI at 78 signals overbought conditions, suggesting a pullback to $19.55 support. Declining trading volume reinforces fading momentum.
Trade Idea: Short GT at $19.50, targeting $19.00. Stop loss at $21.27 (above resistance).
Risk: A close above $21.66 could trigger a bullish breakout.
Trade Idea: Short GT at $19.50, targeting $19.00. Stop loss at $21.27 (above resistance).
Risk: A close above $21.66 could trigger a bullish breakout.
Disclaimer
The information and publications are not meant to be, and do not constitute, financial, investment, trading, or other types of advice or recommendations supplied or endorsed by TradingView. Read more in the Terms of Use.
Disclaimer
The information and publications are not meant to be, and do not constitute, financial, investment, trading, or other types of advice or recommendations supplied or endorsed by TradingView. Read more in the Terms of Use.