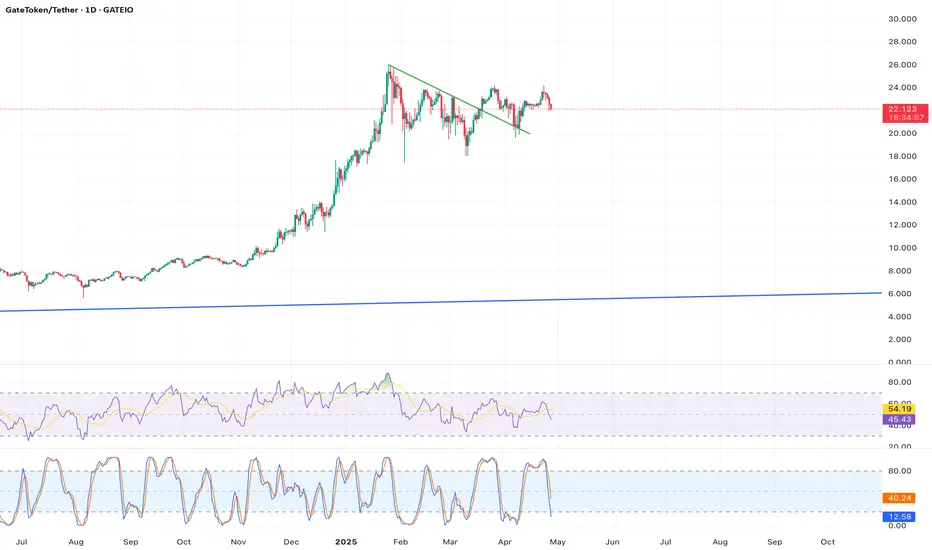
Description: On the monthly chart,  GT appears to be forming an ascending triangle pattern, characterized by higher lows since its 2020 low of $0.2575 and a horizontal resistance around $25-$26 (near the all-time high of $25.94). The current price of $22.145 is approaching the upper resistance line, with increasing bullish momentum as indicated by the MACD showing a bullish crossover on the monthly timeframe. The fully diluted valuation (FDV) of $6.75B suggests significant growth potential if adoption of the Gate.io ecosystem expands. A breakout above $26 could trigger a major rally.
Key Indicators/Patterns: Ascending triangle, higher lows, MACD bullish crossover, FDV analysis.
Price Target: A breakout above $26 could propelGT to $50-$65 by mid-2026, assuming sustained market adoption and favorable crypto market trends.
Timeframe: 12-18 months.
Source Reference: (all-time high and FDV), (technical analysis tools like MACD).
Key Indicators/Patterns: Ascending triangle, higher lows, MACD bullish crossover, FDV analysis.
Price Target: A breakout above $26 could propel
Timeframe: 12-18 months.
Source Reference: (all-time high and FDV), (technical analysis tools like MACD).
Disclaimer
The information and publications are not meant to be, and do not constitute, financial, investment, trading, or other types of advice or recommendations supplied or endorsed by TradingView. Read more in the Terms of Use.
Disclaimer
The information and publications are not meant to be, and do not constitute, financial, investment, trading, or other types of advice or recommendations supplied or endorsed by TradingView. Read more in the Terms of Use.