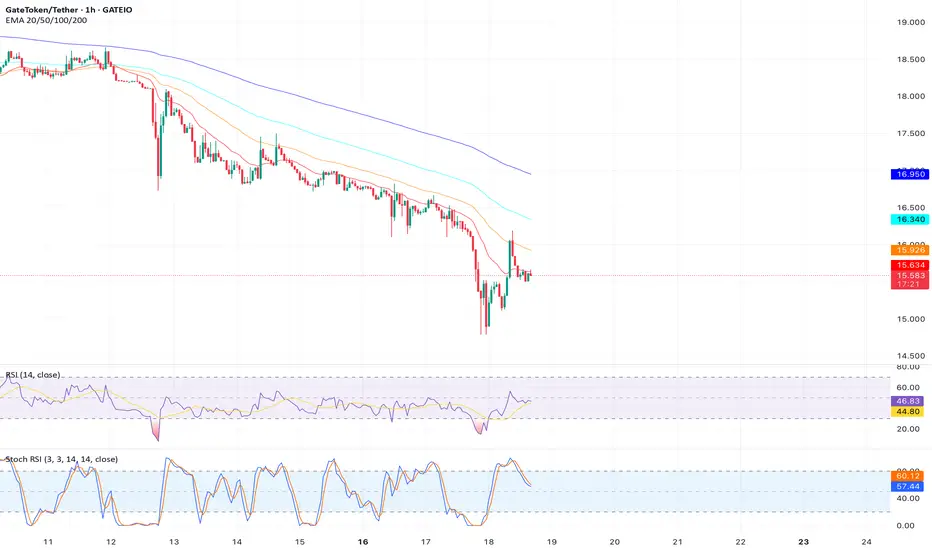
Analysis: The 1-hour chart shows  GT trading near the upper Bollinger Band ($16.20) with an RSI of 78, indicating overbought conditions. A bearish divergence is forming, as the RSI declines while price tests resistance at $15.80. Low volume on recent highs suggests fading momentum.
Key Levels:
Support: $14.80, $14.50
Resistance: $15.80, $16.20
Target: $14.50
Outlook: Short on a rejection at $15.80 with a stop loss above $16.20. Target $14.50 for a 7% pullback. Monitor RSI for continued divergence.
Key Levels:
Support: $14.80, $14.50
Resistance: $15.80, $16.20
Target: $14.50
Outlook: Short on a rejection at $15.80 with a stop loss above $16.20. Target $14.50 for a 7% pullback. Monitor RSI for continued divergence.
Disclaimer
The information and publications are not meant to be, and do not constitute, financial, investment, trading, or other types of advice or recommendations supplied or endorsed by TradingView. Read more in the Terms of Use.
Disclaimer
The information and publications are not meant to be, and do not constitute, financial, investment, trading, or other types of advice or recommendations supplied or endorsed by TradingView. Read more in the Terms of Use.