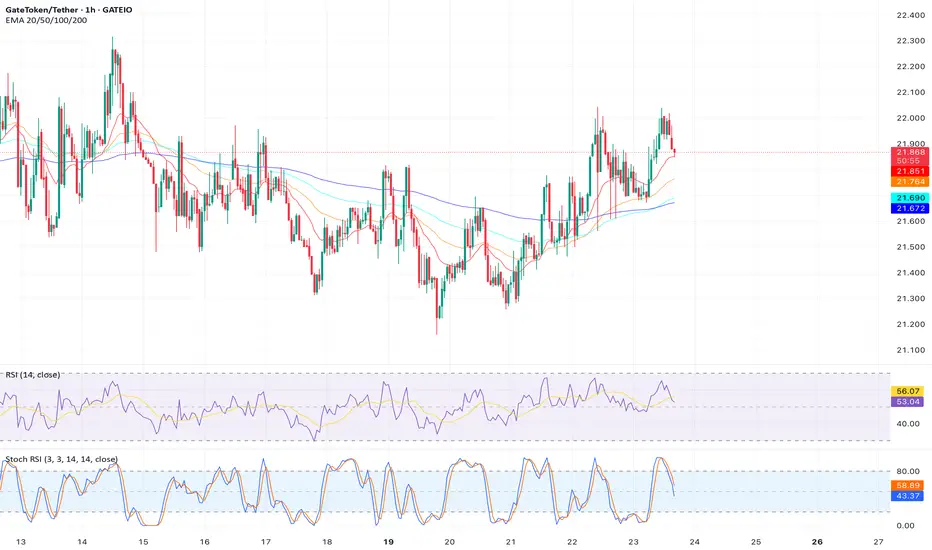
Analysis:  GT has rallied to the 61.8% Fibonacci retracement level ($22.10) from its March 2025 high ($23.50) to its April low ($19.50). This level has historically acted as resistance, and the current price action shows a bearish pinbar rejection. The Stochastic RSI is overbought, and a drop below $21.50 could target the 38.2% Fibonacci level at $20.50.
Trade Plan:
Entry: $21.70 (post-rejection confirmation).
Stop Loss: $22.30 (above 61.8% Fib).
Target: $20.50 (38.2% Fib, ~6.3% downside).
Risk-Reward Ratio: 1:1.5.
Timeframe: 3-7 days.
Indicators: Fibonacci Retracement, Stochastic RSI.
Trade Plan:
Entry: $21.70 (post-rejection confirmation).
Stop Loss: $22.30 (above 61.8% Fib).
Target: $20.50 (38.2% Fib, ~6.3% downside).
Risk-Reward Ratio: 1:1.5.
Timeframe: 3-7 days.
Indicators: Fibonacci Retracement, Stochastic RSI.
Disclaimer
The information and publications are not meant to be, and do not constitute, financial, investment, trading, or other types of advice or recommendations supplied or endorsed by TradingView. Read more in the Terms of Use.
Disclaimer
The information and publications are not meant to be, and do not constitute, financial, investment, trading, or other types of advice or recommendations supplied or endorsed by TradingView. Read more in the Terms of Use.