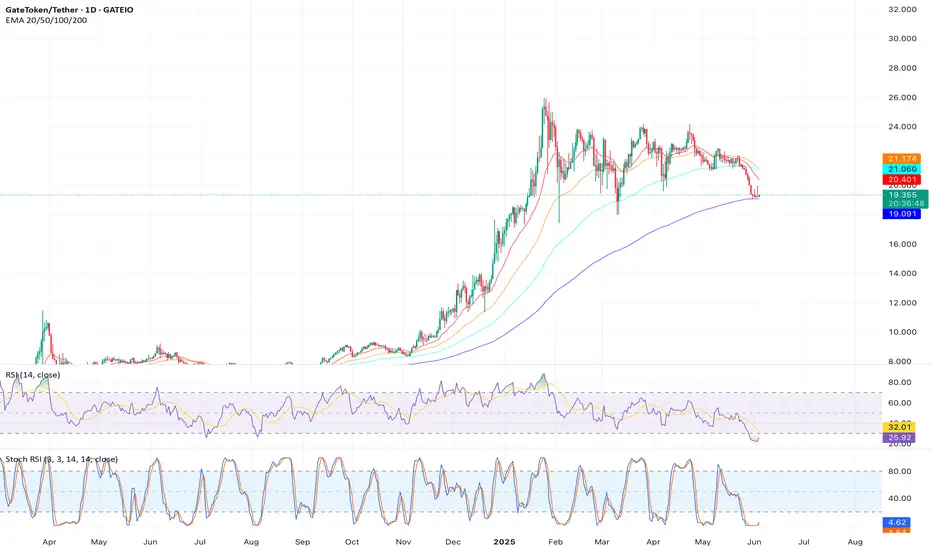
Analysis: At $19.37, GT is forming lower highs on the 4-hour chart, signaling bearish momentum. The price is below the 50-day SMA ($21.37), and the Stochastic Oscillator is trending downward. Support at $19.55 is weakening, with $18.99 as the next target if breached.
Outlook: Short on a break below $19.55, targeting $18.99, with a stop-loss above $19.32.
Outlook: Short on a break below $19.55, targeting $18.99, with a stop-loss above $19.32.
Disclaimer
The information and publications are not meant to be, and do not constitute, financial, investment, trading, or other types of advice or recommendations supplied or endorsed by TradingView. Read more in the Terms of Use.
Disclaimer
The information and publications are not meant to be, and do not constitute, financial, investment, trading, or other types of advice or recommendations supplied or endorsed by TradingView. Read more in the Terms of Use.