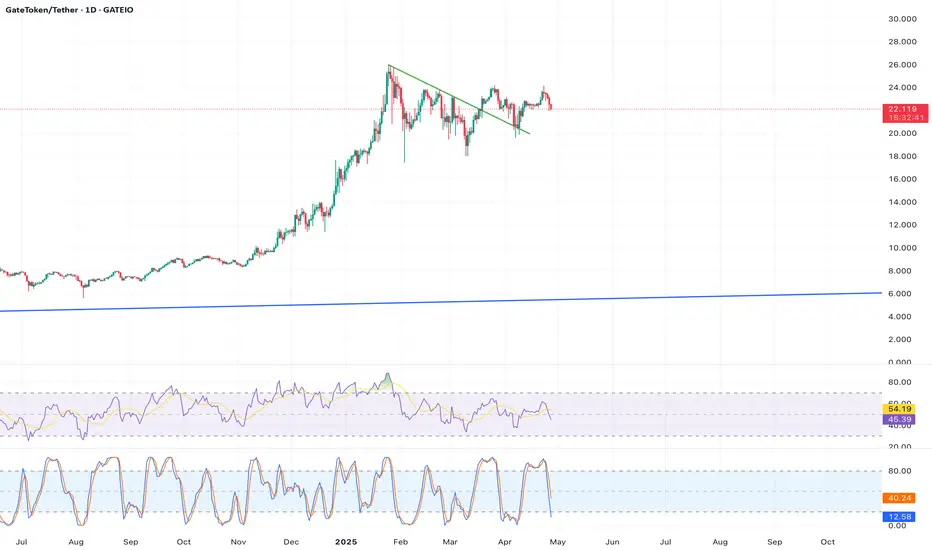
Analysis: The weekly chart for  GT shows a strong uptrend since its 2020 low of $0.2575, with higher highs and higher lows forming a bullish channel. The 50-week Simple Moving Average (SMA) at approximately $18.50 acts as dynamic support, and the current price of $22.145 is well above this level, indicating sustained bullish momentum. The Relative Strength Index (RSI) on the weekly timeframe is at 60, suggesting room for further upside before entering overbought territory (>70). The MACD line is above the signal line, with a positive histogram, reinforcing bullish sentiment. Recent market cap growth to $2.74B and Gate.io’s ecosystem expansion (e.g., GT Hub launch) support fundamental bullishness.
Price Target/Outlook: IfGT breaks above the January 2025 all-time high of $25.94, it could target $30–$32 by Q3 2025, assuming continued adoption and market stability. A stop-loss below $18.50 is prudent for risk management.
Price Target/Outlook: If
Disclaimer
The information and publications are not meant to be, and do not constitute, financial, investment, trading, or other types of advice or recommendations supplied or endorsed by TradingView. Read more in the Terms of Use.
Disclaimer
The information and publications are not meant to be, and do not constitute, financial, investment, trading, or other types of advice or recommendations supplied or endorsed by TradingView. Read more in the Terms of Use.