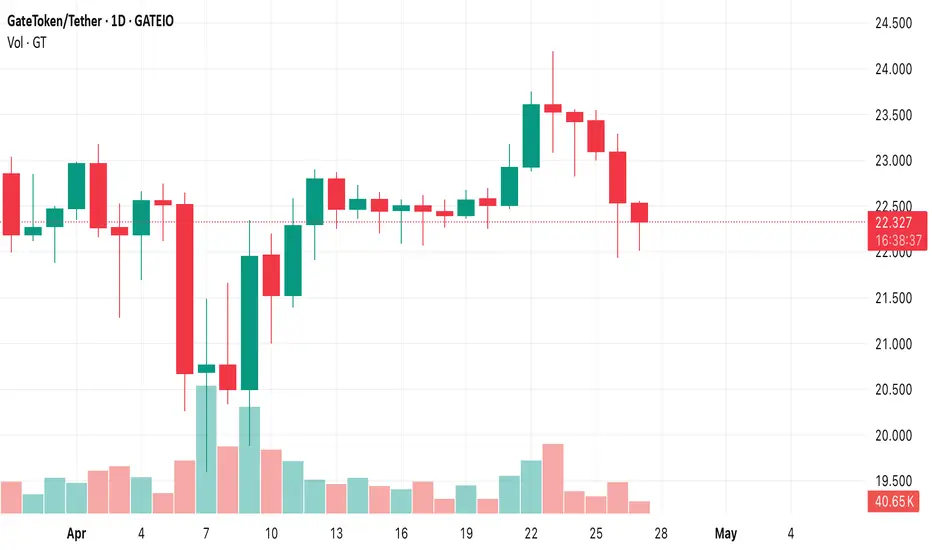
Analyzing the recent price action of GT/USDT on Gate.io, we observe a current trading price of $22.294, reflecting a 3.86% decrease. This movement suggests a possible short-term bearish trend. The Moving Averages (MA) indicate a divergence, with the 5-day MA at $22.452, which could signal a potential reversal if the price stabilizes above this level. MACD indicators also show a bearish crossover, with MACD at -0.12 and DIF at -0.197, suggesting a continuation of the downward trend in the near term. Traders might consider this an opportunity to enter short positions or wait for a clearer signal of a trend reversal. It's crucial to monitor market sentiment and adjust trading strategies accordingly to capitalize on the volatility of the GT/USDT pair.
Disclaimer
The information and publications are not meant to be, and do not constitute, financial, investment, trading, or other types of advice or recommendations supplied or endorsed by TradingView. Read more in the Terms of Use.
Disclaimer
The information and publications are not meant to be, and do not constitute, financial, investment, trading, or other types of advice or recommendations supplied or endorsed by TradingView. Read more in the Terms of Use.