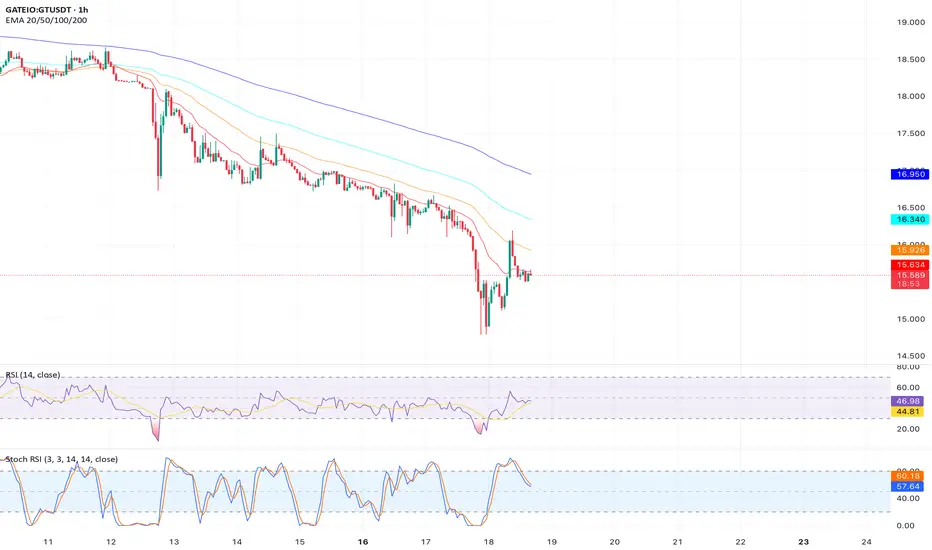
Analysis:  GT has bounced off the critical $15.00 support level on the 4-hour chart, forming a double bottom pattern. The MACD shows a bullish crossover, and the price is trading above the 20-period EMA ($15.45). The Fear & Greed Index is neutral, suggesting room for bullish sentiment. A move above $16.00 could trigger a rally toward the next resistance zone.
Key Levels:
Support: $15.00, $14.50
Resistance: $16.00, $17.72
Target: $19.00
Outlook: Long on a break above $16.00 with a stop loss below $14.80. Target $19.00 for a 20%+ move. Watch for increased buying volume to confirm momentum.
Key Levels:
Support: $15.00, $14.50
Resistance: $16.00, $17.72
Target: $19.00
Outlook: Long on a break above $16.00 with a stop loss below $14.80. Target $19.00 for a 20%+ move. Watch for increased buying volume to confirm momentum.
Disclaimer
The information and publications are not meant to be, and do not constitute, financial, investment, trading, or other types of advice or recommendations supplied or endorsed by TradingView. Read more in the Terms of Use.
Disclaimer
The information and publications are not meant to be, and do not constitute, financial, investment, trading, or other types of advice or recommendations supplied or endorsed by TradingView. Read more in the Terms of Use.