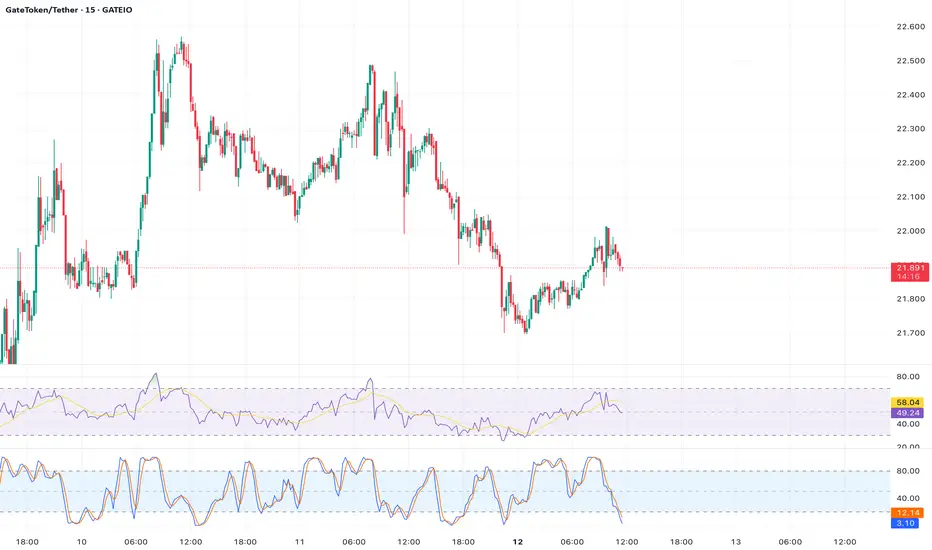
Analysis: The Stochastic RSI for  GT is above 0.8, indicating overbought conditions and a likely correction. The price is trading at $21.98, just below the $22.15 EMA, which has acted as dynamic resistance. The 4-hour chart shows a bearish divergence, with price highs not confirmed by RSI peaks. A break below $21.47 could lead to a decline toward $19.95, with $18.74 as a deeper support level.
Entry Point: $21.80
Target Price: $19.95
Stop Loss: $22.30
Timeframe: 1–2 weeks
Rationale: Overbought Stochastic RSI and bearish divergence on the 4-hour chart suggestGT is primed for a short-term correction, aligning with resistance at $22.15.
Entry Point: $21.80
Target Price: $19.95
Stop Loss: $22.30
Timeframe: 1–2 weeks
Rationale: Overbought Stochastic RSI and bearish divergence on the 4-hour chart suggest
Disclaimer
The information and publications are not meant to be, and do not constitute, financial, investment, trading, or other types of advice or recommendations supplied or endorsed by TradingView. Read more in the Terms of Use.
Disclaimer
The information and publications are not meant to be, and do not constitute, financial, investment, trading, or other types of advice or recommendations supplied or endorsed by TradingView. Read more in the Terms of Use.