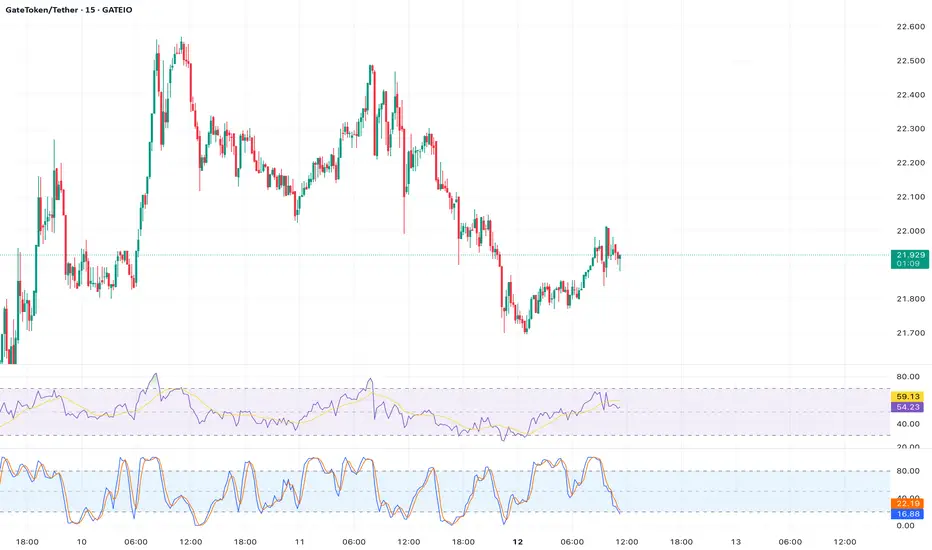
Analysis:  GT’s 14-day RSI recently dipped to 26.10, signaling oversold conditions, which often precede price reversals. The price is trading near the key support level of $19.55, a zone that has held firm in past corrections. A bullish divergence is forming on the MACD, where the histogram shows decreasing bearish momentum despite lower price lows. The Bollinger Bands are contracting, suggesting reduced volatility and a potential breakout. If GT holds above $19.55 and RSI climbs above 30, a move toward the $21.15 resistance is likely, with further upside to $22.02 in the short term.
Entry Point: $19.70
Target Price: $22.02
Stop Loss: $19.30
Timeframe: 1–2 weeks
Rationale: Oversold conditions, combined with strong support and early signs of bullish momentum on MACD, makeGT a candidate for a near-term reversal, especially given its historical resilience at this price level.
Entry Point: $19.70
Target Price: $22.02
Stop Loss: $19.30
Timeframe: 1–2 weeks
Rationale: Oversold conditions, combined with strong support and early signs of bullish momentum on MACD, make
Disclaimer
The information and publications are not meant to be, and do not constitute, financial, investment, trading, or other types of advice or recommendations supplied or endorsed by TradingView. Read more in the Terms of Use.
Disclaimer
The information and publications are not meant to be, and do not constitute, financial, investment, trading, or other types of advice or recommendations supplied or endorsed by TradingView. Read more in the Terms of Use.