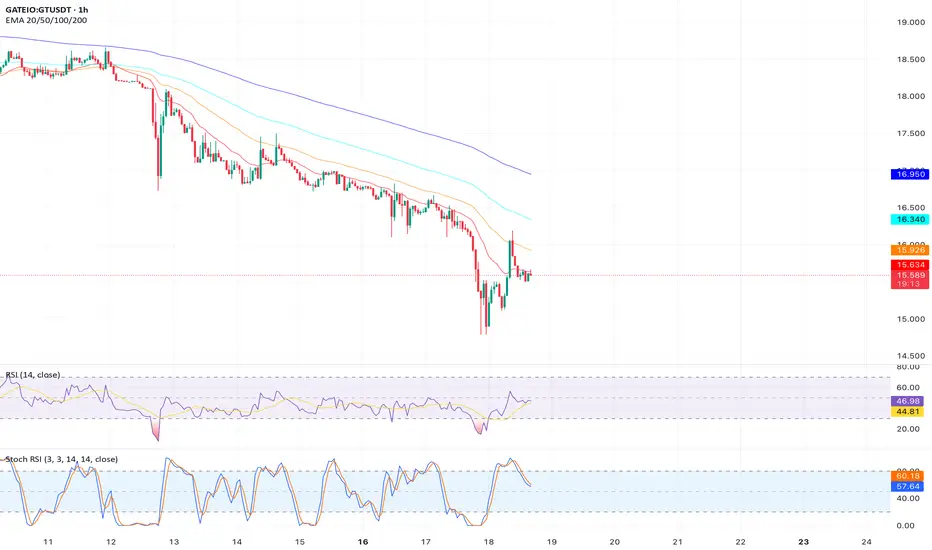
Analysis: On the daily chart,  GT is forming a bullish ascending triangle pattern, with price action respecting higher lows since early June 2025. The 50-day SMA ($15.80) is acting as dynamic support, while the RSI (currently at 52) indicates neutral momentum with room for upside. Volume is increasing on bullish candles, suggesting accumulation. A breakout above the $16.50 resistance could confirm bullish continuation.
Key Levels:
Support: $15.30 (50-day SMA), $14.80
Resistance: $16.50, $17.20
Target: $18.00 (measured move from triangle)
Outlook: Long on a close above $16.50 with a stop loss below $15.30. Target $18.00 for a 15%+ gain. Monitor volume for confirmation of breakout strength.
Key Levels:
Support: $15.30 (50-day SMA), $14.80
Resistance: $16.50, $17.20
Target: $18.00 (measured move from triangle)
Outlook: Long on a close above $16.50 with a stop loss below $15.30. Target $18.00 for a 15%+ gain. Monitor volume for confirmation of breakout strength.
Disclaimer
The information and publications are not meant to be, and do not constitute, financial, investment, trading, or other types of advice or recommendations supplied or endorsed by TradingView. Read more in the Terms of Use.
Disclaimer
The information and publications are not meant to be, and do not constitute, financial, investment, trading, or other types of advice or recommendations supplied or endorsed by TradingView. Read more in the Terms of Use.