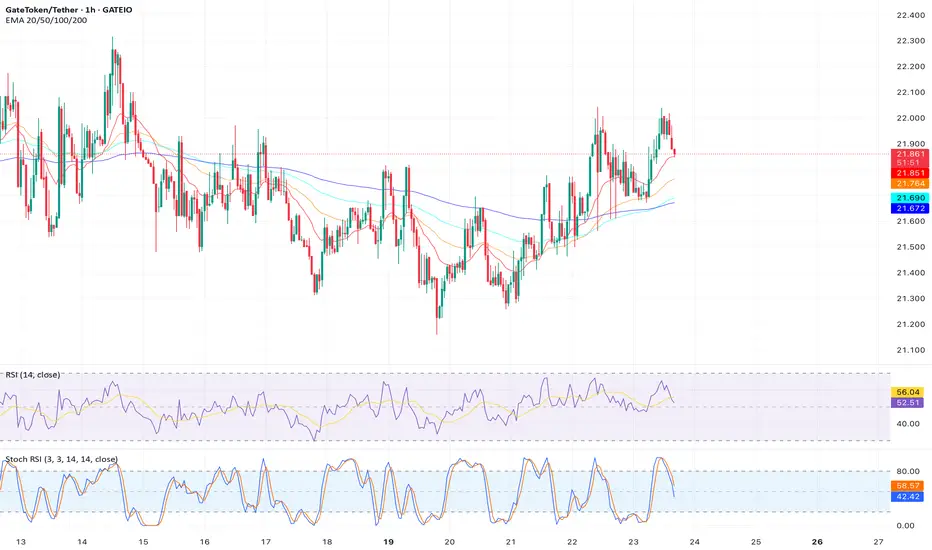
Analysis:  GT faces strong resistance at $22.00, where it was rejected twice in the past month, forming a double-top pattern. The RSI (14) at 62 is nearing overbought, indicating weakening momentum. The stock’s 10.95% monthly gain suggests overextension, and a bearish divergence on the MACD (price rising, MACD falling) supports a potential reversal. A drop below $21.50 could accelerate selling toward $19.50.
Trade Plan:
Entry: $21.70 (break below $21.85 with confirmation).
Stop Loss: $22.50 (above resistance).
Target: $19.50 (next support, ~10.3% downside).
Risk-Reward Ratio: 1:2.
Timeframe: 1-2 weeks.
Indicators: RSI, MACD, Double-Top Pattern.
Trade Plan:
Entry: $21.70 (break below $21.85 with confirmation).
Stop Loss: $22.50 (above resistance).
Target: $19.50 (next support, ~10.3% downside).
Risk-Reward Ratio: 1:2.
Timeframe: 1-2 weeks.
Indicators: RSI, MACD, Double-Top Pattern.
Disclaimer
The information and publications are not meant to be, and do not constitute, financial, investment, trading, or other types of advice or recommendations supplied or endorsed by TradingView. Read more in the Terms of Use.
Disclaimer
The information and publications are not meant to be, and do not constitute, financial, investment, trading, or other types of advice or recommendations supplied or endorsed by TradingView. Read more in the Terms of Use.