Analysis:
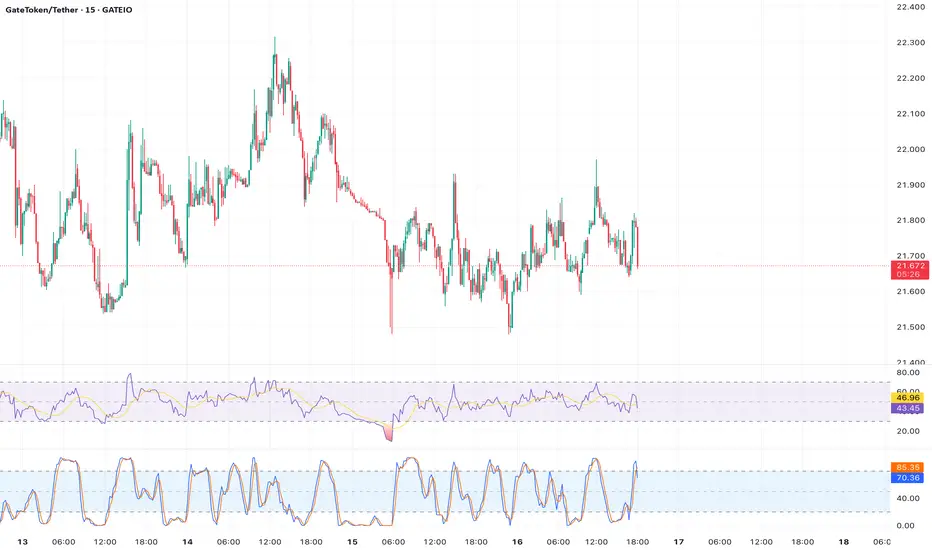
GateToken (GT) is currently trading at $21.5, hovering near a critical resistance zone at $21.66–$22.15, as identified by recent price action and the 14-day exponential moving average (EMA). The daily chart shows GT forming higher highs and higher lows since its recent low of $17.72, indicating a short-term uptrend. However, the Relative Strength Index (RSI) at 65 is approaching overbought territory, suggesting potential exhaustion among buyers. The On-Balance Volume (OBV) remains flat, indicating a lack of strong buying pressure to sustain a breakout above $22.15.
The 50-day Simple Moving Average (SMA) at $18.19 provides strong support, with additional support at $19.55 if a pullback occurs. The Bollinger Bands show GT trading in the upper half, testing the upper band repeatedly, which could signal overbought conditions. A Fibonacci retracement from the all-time high of $25.94 to the cycle low of $17.72 places the 61.8% level at $22.71, aligning with the next resistance if $22.15 is breached.
Outlook: If GT breaks above $22.15 with increased volume, it could target $24.19 or higher. Conversely, failure to hold $21.15 may lead to a retracement toward $19.55 or the 50-day SMA. Traders should watch for volume spikes and RSI divergence for confirmation of the next move. Risk-averse investors may wait for a dip to $19.55 before entering long positions.
Disclaimer
The information and publications are not meant to be, and do not constitute, financial, investment, trading, or other types of advice or recommendations supplied or endorsed by TradingView. Read more in the Terms of Use.
Disclaimer
The information and publications are not meant to be, and do not constitute, financial, investment, trading, or other types of advice or recommendations supplied or endorsed by TradingView. Read more in the Terms of Use.